Figures & data
Figure 1 Scanning electron micrographs of electrosprayed microparticles (A–D), and digital images of PLGA, PLGA-F127, PLGA-P123, and PLGA-L121 microparticles dispersions in water (E–F). (A) PLGA microparticles. (B) PLGA-Pluronic® F127 microparticles. (C) PLGA-Pluronic® P123 microparticles. (D) PLGA-Pluronic® L121 microparticles. Low magnification images: scale bar 10 μm; insets (top right) are high magnification images: scale bar 1 μm; insets (bottom right) S and ZP represented as mean ± standard deviation in μm and mV, respectively. (E) Before sonication. (F) After sonication.
Abbreviations: PLGA, poly(lactide-co-glycolide); S, size; ZP, zeta potential.
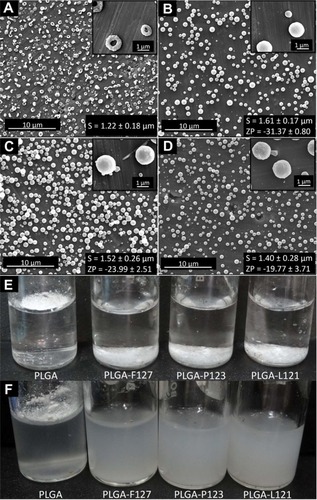
Figure 2 Plot of partition coefficient (determined by Rose Bengal assay) against weight of microparticles.
Notes: Green: PLGA-F127 (R2 = 0.99, P value = 0.0018); blue: PLGA-P123 (R2 = 0.97, P value = 0.0136); and red: PLGA-L121 (R2 = 0.99, P value = 0.0029) with corresponding linear trend lines (black dotted lines) for slope determination. For values of P < 0.05, the difference is statistically significant.
Abbreviations: PLGA, poly(lactide-co-glycolide); R2, Pearson’s correlation coefficient.
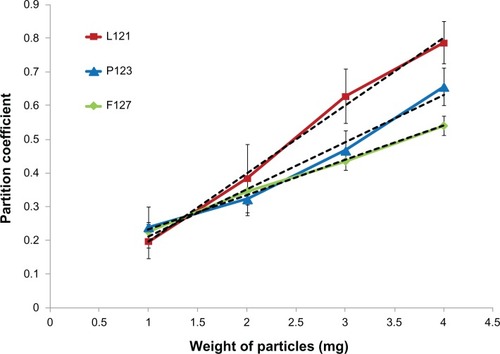
Figure 3 XPS analysis of surface chemistry. (A) Chemical structure of PLGA and Pluronic® representing its monomer units. (B) Deconvoluted C-1s XPS spectra (binding energy versus intensity) of microparticles fabricated from PLGA-F127, PLGA-P123 and PLGA-L121. (C) Graphic representing differences in EO chains lengths of Pluronic® F127, Pluronic® P123, and Pluronic® L121 on the surface of electrosprayed PLGA-Pluronic® microparticles.
Abbreviations: EO, ethylene oxide; PEO, poly(ethylene oxide); PLGA, poly(lactide-co-glycolide); PPO, poly(propylene oxide); XPS, X-ray photoelectron spectroscopy.
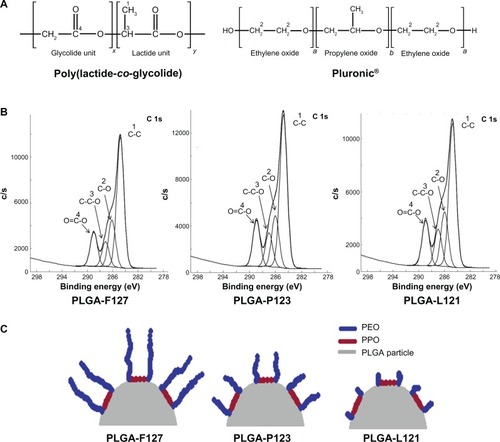
Table 1 Concentration in atomic percentage of various components of C-1s on surface of PLGA-Pluronic® microparticles derived from XPS spectra along with values of monomer ratio, mass ratio, and As
Table S1 Molecular weight of monomers for PLGA and Pluronic®