Figures & data
Scheme 1 Strategy of combination therapy via isoniazid and core-shell magnetic nanosphere to enhance radiotherapy.
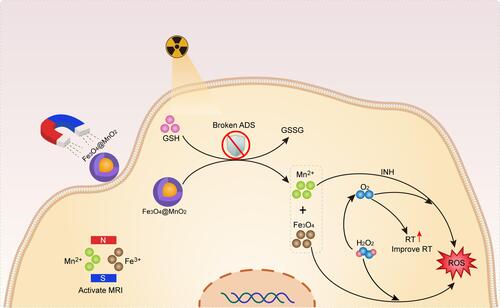
Figure 1 Structure and property characterizations. (A) TEM image, (B) XRD analysis. *Represents peaks of Fe3O4 and · represents peaks of MnO2. (C) XPS spectra of Fe3O4@MnO2 NPs. (D) Mn 2p and (E) Fe 2p of Fe3O4@MnO2 NPs.
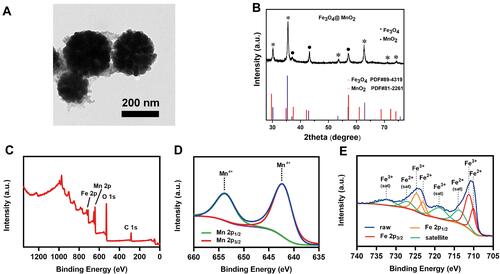
Figure 2 Fenton-like reaction assessment. (A) GSH consumption in existence with 100 μg/mL of NPs. (B) Percentage of MB concentration after various treatments. (C) MB degradation under various treatments. ***P < 0.005; Student’s t-test.
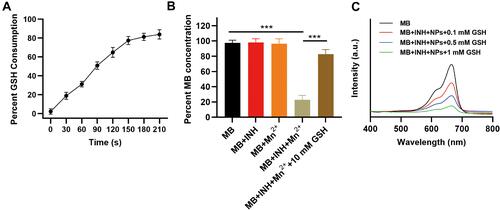
Figure 3 Antitumor efficacy in vitro. (A) γ-H2AX staining of cells; (B) Cell viability tested using CCK 8 kit. (C) DCFH-DA staining of cells. (D) Fluorescence intensity detection using flow cytometry. (E) Colony formation assay. (F) Wounding assay. (RT: 6Gy; NPs: 100 μg/mL; INH: 20 μg/mL). ***P < 0.005; Student’s t-test.
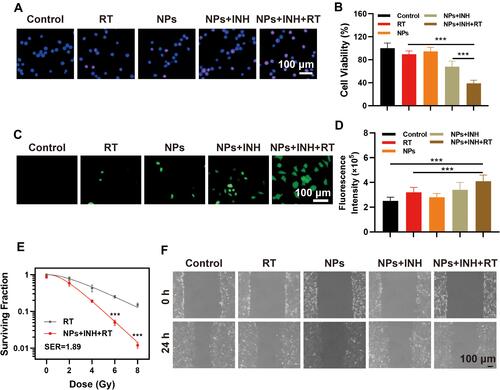
Figure 4 Pimonidazole staining of tumor slices 24 h post intravenous injection of PBS or NPs (100 μL, 100 μg/mL; Scale bar: 100 μm).
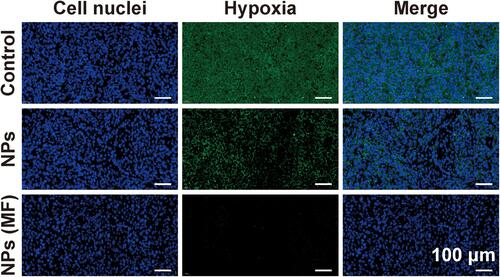
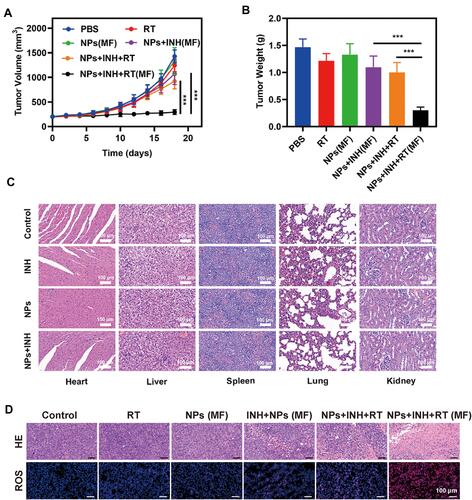
Figure 5 Antitumor efficacy in vivo. (A) Tumor volume changes and (B) tumor weights. (C) HE staining of main organs sections of mice (Scale bar: 100 μm) (D) HE staining and ROS staining of tumors of mice received different treatment (Scale bar: 100 μm). ***P < 0.005; Student’s t-test.