Figures & data
Figure 1 Procedure for immobilization of streptavidin on the DNA-SWNT surface, and binding of biotinylated IgG to immobilized streptavidin to prepare the DNA-SWNT antibody complex. (A) Suspension of DNA-SWNT antibody complex.
Abbreviations: Ab, antibody; SWNT, single-walled carbon nanotubes; NHS, N-hydroxysuccinimide; EDC, 1-ethyl-3(3-dimethylaminopropyl) carbodiimide hydrochloride.
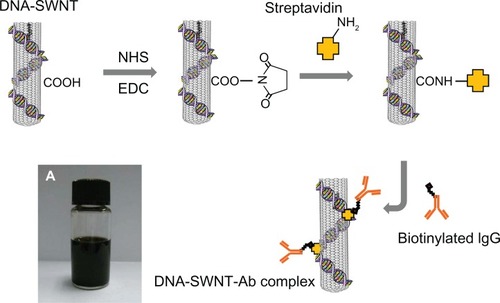
Table 1 Binding ratio of the SWNT antibody and the DNA-SWNT antibody complexes calculated from quartz crystal microbalance data
Figure 2 Typical frequency changes for (A) streptavidin immobilized to DNA-SWNT according to the quartz crystal microbalance sensor, and (B) binding of biotinylated anti-human IgG to the streptavidin-immobilized DNA-SWNT according to the quartz crystal microbalance sensor.
Abbreviation: SWNT, single-walled carbon nanotubes.
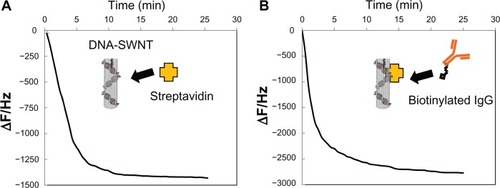
Figure 3 Selective binding of the SWNT antibody complex to target protein in the presence or absence of DNA. Either human IgG or rabbit IgG was adhered to the bottom of a microplate well. Initial rates of oxidized TMB production are plotted against the concentration of the SWNT antibody complex. (A) SWNT was not treated with DNA. (B) SWNT was treated with DNA, and the buffer contained 1 mg/mL DNA.
Note: ***P < 0.01, compared with the corresponding value for rabbit IgG as the target protein (n = 4).
Abbreviations: TMB, 3,3′,5,5′-tetramethylbenzidine; SWNT, single-walled carbon nanotubes.
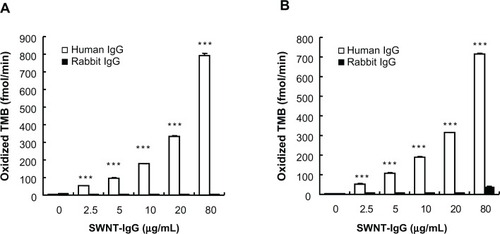
Figure 4 Binding of the SWNT antibody complex to its specific target. (A) Typical saturation curve. (B) Lineweaver–Burk plots. The data derived from the saturation curve were fitted to the dashed line (see text). The line represents 1/Vmax (obtained from ordinate intercept) and 1/Km (obtained from abscissa intercept). 1/v = 0.007373 (1/[SWNT]) + 0.000812, R2 = 0.999. Vmax,SWNT = 1231, Km,SWNT = 9.09 (μg/mL). (C) Hill plots. Slope of the line represents nH = 0.959.
Abbreviations: TMB, 3,3′,5,5′-tetramethylbenzidine; SWNT, single-walled carbon nanotubes.
![Figure 4 Binding of the SWNT antibody complex to its specific target. (A) Typical saturation curve. (B) Lineweaver–Burk plots. The data derived from the saturation curve were fitted to the dashed line (see text). The line represents 1/Vmax (obtained from ordinate intercept) and 1/Km (obtained from abscissa intercept). 1/v = 0.007373 (1/[SWNT]) + 0.000812, R2 = 0.999. Vmax,SWNT = 1231, Km,SWNT = 9.09 (μg/mL). (C) Hill plots. Slope of the line represents nH = 0.959.Abbreviations: TMB, 3,3′,5,5′-tetramethylbenzidine; SWNT, single-walled carbon nanotubes.](/cms/asset/406fbdc4-6bd0-42e7-afeb-bc7caea80921/dijn_a_34202_f0004_b.jpg)
Table 2 Binding affinity and capacity of SWNT-Ab and IgG itself to the target molecule in the absence of DNA
Figure 5 Binding of IgG to its specific target. (A) Typical saturation curve. (B) Lineweaver–Burk plots. The data derived from the saturation curve were fitted to the dashed line (see text). The line represents 1/Vmax (obtained from ordinate intercept) and 1/Km (obtained from abscissa intercept). 1/v = 0.041700 (1/[IgG]) + 0.000719, R2 = 0.999. Vmax,IgG = 1391, Km,IgG = 58.0 (ng/mL). (C) Hill plots. Slope of the line represents nH = 0.957.
Abbreviation: TMB, 3,3′,5,5′-tetramethylbenzidine.
![Figure 5 Binding of IgG to its specific target. (A) Typical saturation curve. (B) Lineweaver–Burk plots. The data derived from the saturation curve were fitted to the dashed line (see text). The line represents 1/Vmax (obtained from ordinate intercept) and 1/Km (obtained from abscissa intercept). 1/v = 0.041700 (1/[IgG]) + 0.000719, R2 = 0.999. Vmax,IgG = 1391, Km,IgG = 58.0 (ng/mL). (C) Hill plots. Slope of the line represents nH = 0.957.Abbreviation: TMB, 3,3′,5,5′-tetramethylbenzidine.](/cms/asset/0c6fc786-20fe-4ceb-80d5-bc1c7aef3a68/dijn_a_34202_f0005_b.jpg)
Table 3 Binding affinity and capacity of DNA-treated SWNT-Ab and IgG itself to the target molecule in the presence of DNA
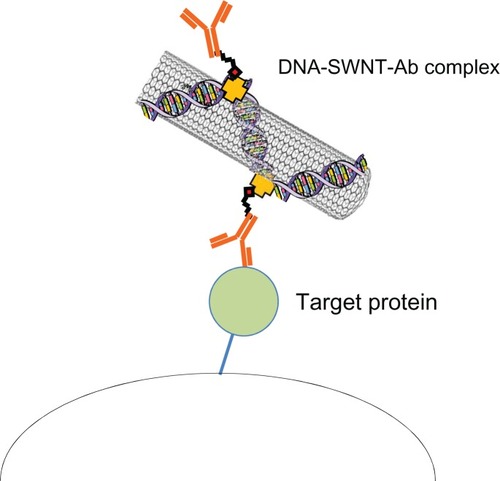
Figure 6 Schematic illustration of the DNA-SWNT antibody complex and binding to its target protein.
Abbreviations: Ab, antibody; SWNT, single-walled carbon nanotubes.