Figures & data
Table 1 The Box-Behnken Design Levels Utilized for CT-CS-LPs Optimization
Table 2 The Experimental Design Runs and Independent and Dependent Factors for CT-CS-LPs Formulation Based on the Box-Behnken Design
Figure 1 3D response surface plots for the effects of independent variables (lipid amount, CS concentration, and cholesterol amount) on response variables: (A–C) (effect on vesicle size (VS), (D–F) (effect on entrapment efficiency (EE (%)), and (G–I) (effect on zeta potential (ZP)) of CT-CS-LPs formulations.
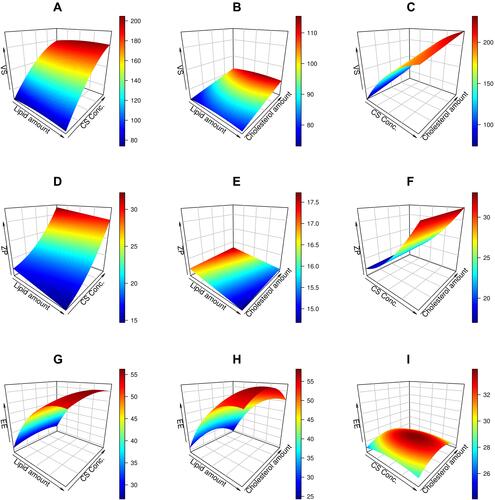
Table 3 The Optimized CT-CS-LPs Formulation Composition, Laboratory Recorded and Model-Predicted Values
Table 4 Semi-Quantitative Scoring of the Healing Process in Diabetic Rats of the Different Studied Groups Using Sections Stained with H&E X100
Figure 2 The optimized CT-CS-LPs and CT solution in vitro release profiles.
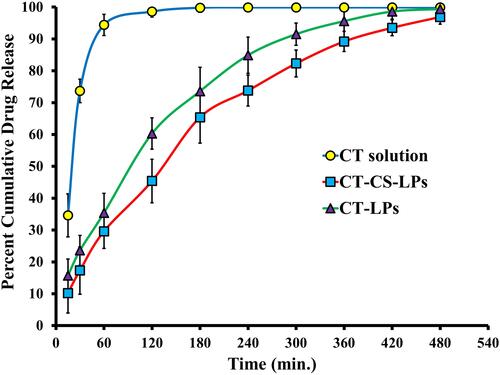
Figure 3 The TEM image of the optimized CT-CS-LPs formulation.
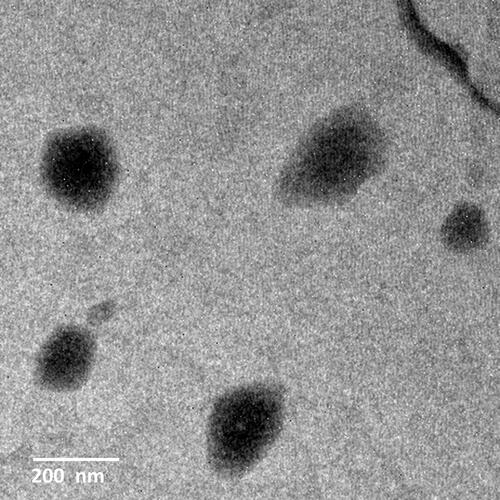
Figure 4 The size and entrapment of the optimized CT-CS-LPs formulation after 90 days of storage.
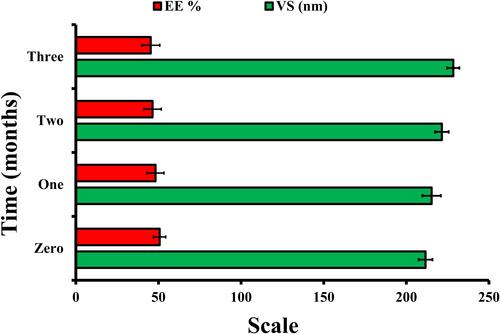
Figure 5 Photographs of wound healing were taken on the 0th, 3rd, 6th, 9th, 12th, and 14th days in different diabetic rats in; control (untreated), chitosan-coated liposomes without citicoline (CS-LPs), free citicoline (free CT), and optimized citicoline chitosan-coated liposomes (CT-CS-LPs) groups.
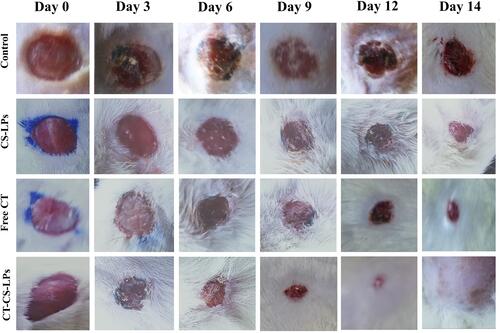
Figure 6 Percent area of wound healing in treated diabetic rats on the 3rd, 6th, 9th, 12th, and 14th days after wound creation in; control (untreated), chitosan-coated liposomes without citicoline (CS-LPs), free citicoline (free CT), and optimized citicoline chitosan-coated liposomes (CT-CS-LPs) groups.
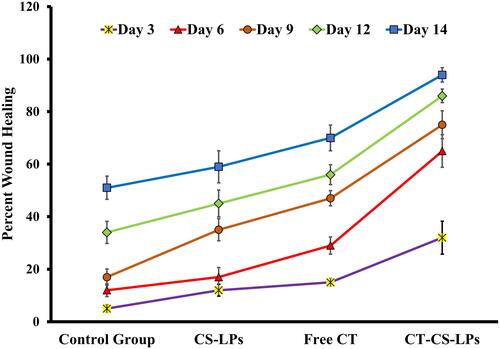
Figure 7 Microscopic evaluation of the healing process in the skin wound sections in the diabetic rats of all studied groups showing: (A) the wound gap length (µm), using sections stained with H&E. X40. (B) The granulation tissue thickness (µm), using sections stained with H&E. X40. (C) The percent area of the total collagen fibers, using sections stained with Crossman’s trichrome stain X100. (D) The percent area of the total collagen fibers, using sections stained with Picrosirius red stain (bright-field View) X100. (E) The percent area of the mature collagen fibers, using sections stained with Picrosirius red stain (polarized-field view) X200. (F) The relative percent area of VEGF immunoexpression, using sections stained with VEGF Antibody X400. (A) illustrates a significant variation when compared to the control group, (B) illustrates a significant variation when compared to CS-LPs group, and c illustrates a significant variation when compared to free citicoline group.
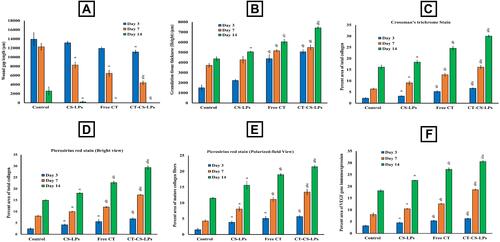
Figure 8 Representative photomicrographs of skin sections (H&E stain) from all studied groups on the 3rd, 7th, and 14th days post wound creation showing; Control (A1–A6), CS-LPs (B1–B6), Free CT (C1–C6), and CT-CS-LPs (D1–D6) groups. Notice: inflammatory cells (thin arrows), fibroblast (thick arrows), congested blood vessels (*), microvessels (arrow heads), scab (S), blood arterioles (zigzagged arrows), the regenerated epidermis (E), collagen bundles (C), hair follicles (F) and sebaceous gland (G).
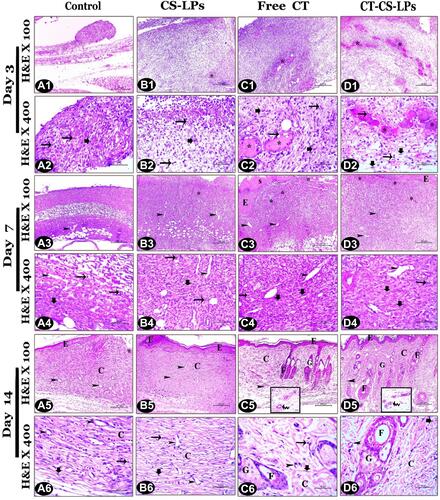
Figure 9 Photomicrographs of skin sections from all studied groups on the 3rd, 7th, and 14th days post wound creation, showing the total collagen fibers appeared green by Crossman’s trichrome stain and red by Picrosirius red stain (bright-field view); control (A1–A6), CS-LPs (B1–B6), Free CT (C1–C6) and CT-CS-LPs (D1–D6) groups.
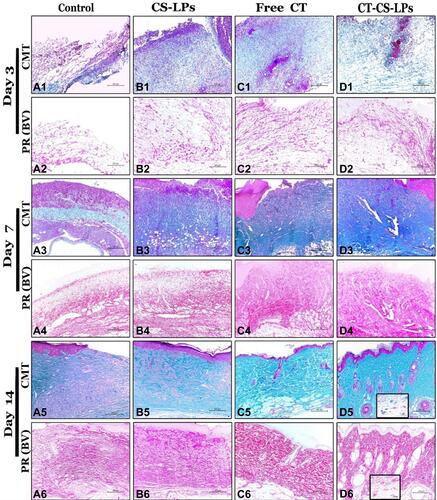
Figure 10 Photomicrographs of skin sections from all studied groups stained with Picrosirius red stain (polarized-field view), on the 3rd, 7th, and 14th days post wound creation showing: control (A1–A3), CS-LPs (B1–B3), Free CT (C1–C3) and CT-CS-LPs (D1–D3) groups. The shiny red fibers were the mature collagen, while the immature appeared light green.
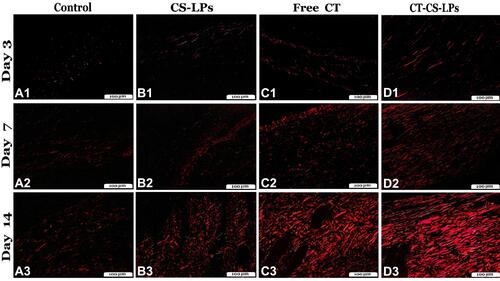
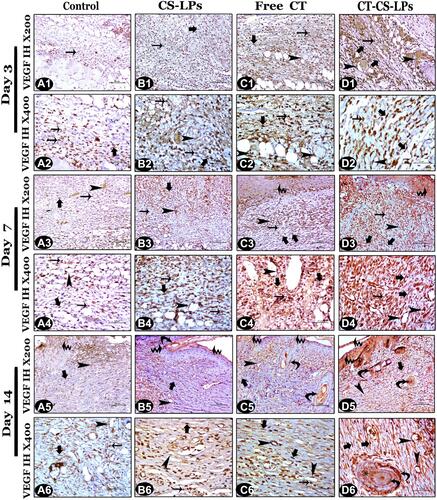
Figure 11 Vascular Endothelial Growth Factor (VEGF) immunohistochemistry photomicrographs from all studied groups on the 3rd, 7th, and 14th days post wound creation, showing: control group with minimal VEGF immunoexpression (A1–A6). CS-LPs group with mild VEGF immunoexpression (B1–B6). Free CT group with moderate VEGF immunoexpression (C1–C6). CT-CS-LPs group with strong VEGF immunoexpression (D1–D6).