Figures & data
Figure 1 Identification of exosomes. (A) The morphology of DPT-exos and DPC-exos; (B) the diameter distribution of DPT-exos and DPC-exos; (C) surface markers of DPT-exos and DPC-exos. Scale bars: 100 nm.
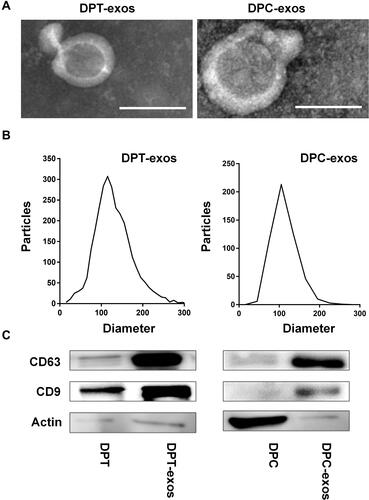
Figure 2 Exosomes promote proliferation and migration of SCAPs and HUVECs. (A) The uptake of DPT-exos and DPC-exos by SCAPs and HUVECs, respectively. (B) The proliferation of SCAPs and HUVECs measured by the CCK-8 assay using the optimal concentration of 160 µg/mL DPT-exos and DPC-exos. (C) Cell migration shown by the Transwell assay. (D) Migrated cells in different fields of view from the Transwell assay. *P=2.35L f−2, ****P<1L f−4, using one-way ANOVA. Scale bars: (A) 50 μm, (C) 100 μm.
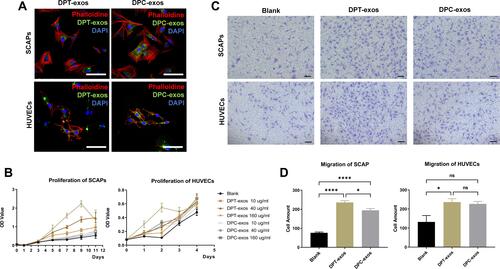
Figure 3 Exosomes promote SCAP differentiation and tube formation. (A) Representative images of ALP and Alizarin Red S staining. (B) Quantitation of ALP activity (***P=7×=i−4,****P<1P s−4,***P=6×**−4, using one-way ANOVA) and Alizarin Red S (****P<1in −4, ns=no statistical significance, using one-way ANOVA). (C and D). In vitro tube formation of HUVECs and lengths of tubes (*P=1.09×10⁻²,**P=1.4×10⁻³, ns=no statistical significance, using one-way ANOVA) and total number of nodes (*P=1.9×10⁻², ns=no statistical significance using one-way ANOVA) and up-regulation after treatment with DPT-exos (160 μg/mL) and DPC-exos (160 µg/mL). Scale bars: (A) 1 cm, (C) 200 μm and 100 μm.
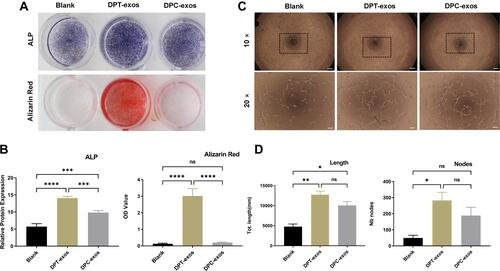
Figure 4 DPT-exos induce the regeneration of pulp-like tissue. H&E staining showing odontoblast-like cells (black arrows), rich blood vessels (red arrows), and regenerated dentin-like tissue (blue arrows) at the interface between the dentin and pulp-like tissue in the DPT-exos+SCAPs+Col-I group. Only sparse blood vessels (red arrows) and immature regenerated dentin-like tissue were seen in DPC-exos+SCAPs+Col-I group. Scale bars: 1 mm and 100 μm.
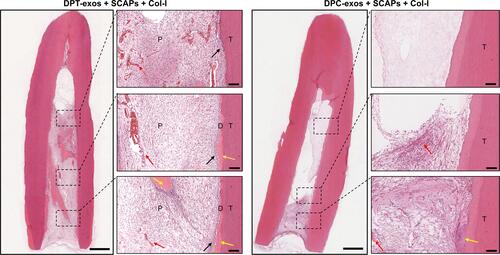
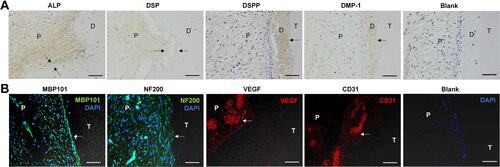
Figure 5 DPT-exos enhance odontogenic and neurogenetic differentiation of SCAPs and revascularization. (A) IHC staining showing positive expression of odontoblastic markers (ALP, DSP, DSPP, DMP1, Blank) in the DPT-exos+SCAPs+Col-I (black arrows). (B) Immunofluorescence showing positive expression of angiogenic markers (CD31 and VEGF) and neurogenetic markers (MBP101 and NF200) in the DPT-exos+SCAPs+Col-I group (white arrows). The PBS negative control did not produce staining in the harvested tissues (Blank). Scale bars: 50 μm.