Figures & data
Table 1 Materials tested, deposition techniques, main growth parameters, surface nanoroughness, stoichiometry, contact angle, and surface free energy parameters of the samples
Figure 1 Atomic force microscopy three-dimensional topography images of: (A) biased titanium (Ti) boron (B) nitride (N) films (TiBN0.95, TiB0.9N0.95, and TiB2.13 films, in sequence); (B) carbon thin films (biased and floating amorphous hydrogenated carbon [a-C:H] coatings); and (C) stainless steel, as reference material.
![Figure 1 Atomic force microscopy three-dimensional topography images of: (A) biased titanium (Ti) boron (B) nitride (N) films (TiBN0.95, TiB0.9N0.95, and TiB2.13 films, in sequence); (B) carbon thin films (biased and floating amorphous hydrogenated carbon [a-C:H] coatings); and (C) stainless steel, as reference material.](/cms/asset/9b855ddf-da41-4366-a3ff-fa4c70c5e70e/dijn_a_34320_f0001_c.jpg)
Figure 2 (A) Cross section of a scanning electron microscopy (SEM) image of carbon nanotubes (CNTs) on the diamond-like carbon (DLC) substrate (inset depicts a cartoon schematic detailing the CNTs deposited onto the DLC substrate). (B) SEM image showing the spaghetti-like structure of the CNTs. (C) Atomic force microscopy (AFM) topography image of the CNTs (circled), with spaghetti-like formation. (D) AFM phase image of the same CNTs shown in (C) the high contrast is indicative of nanopores.
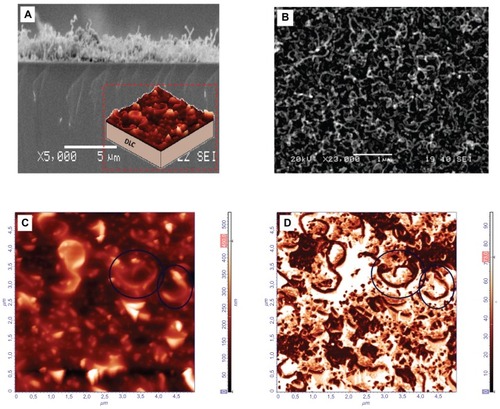
Figure 3 Atomic force microscopy topography images of: (A) platelets on titanium (Ti) boron (B) nitride (N)0.95 film after 1 hour of incubation time (scan size 20 × 20 μm); (B) platelets on TiBN0.95 film after 2 hours of incubation, with a size of 20 × 20 μm (three-dimensional images) – circles indicate the formation of platelet aggregation; (C) platelets on TiB0.9N0.95 film after 1 hour of incubation; (D) platelets on TiB0.9N0.95 film after 2 hours of incubation time; (E) platelets on stainless steel, as control material, after 1 hour of cell adhesion; (F) platelets on stainless steel after 2 hours of incubation; (G) platelets on TiB0.9N0.95 film after 1 hour of incubation, corresponding to (C) (two-dimensional image). (H) Arbitrary cross section of image shown in (G).
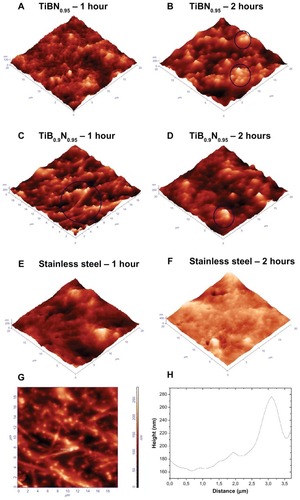
Figure 4 Atomic force microscopy (AFM) topography images of platelets on titanium (Ti) boron (B)2.13 thin films: (A) after 1 hour of incubation, the cells developed pseudopodia and formed a network; (B) after 2 hours of incubation, platelet aggregation prevailed; (C) cross section at 16.9 μm, marked with the black circle, an activated platelet with pseudopodia (left) and, marked with the lines, the platelet and plasma protein aggregated on TiB2.13 thin films (right); (D) scanning electron microscopy (SEM) image of a platelet at an early stage of activation; (E) SEM image of activated platelets that have lost their discoid shape and begun to develop pseudopodia; (F) AFM image of platelets obtained on mica after incubation for 2 hours (as control); (G) AFM image of activated platelets with filopodia (scan size of 5 × 5 μm). (H) Arbitrary cross section of an activated platelet along its pseudopodium.
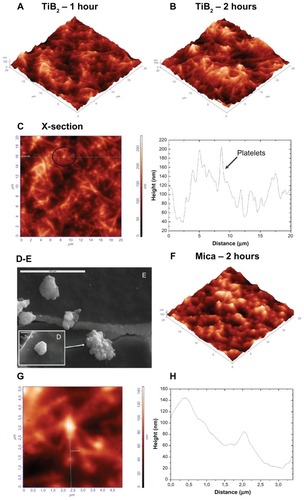
Figure 5 Atomic force microscopy (AFM) topography images of platelets onto: (A) carbon nanotube (CNT)/diamond-like carbon (DLC) coatings after 1 hour of incubation; (B) CNT/DLC coatings after 2 hours of incubation, and (C) 2D AFM image of CNT/DLC coatings after 1 hour of incubation (left) and a x-cross section profile at 12 μm showing a nanopore with a depth of 150nm (right). (D) Amorphous hydrogenated carbon (a-C:H) floating carbon thin films after 2 hours and (E) a-C:H-biased carbon thin films after 2 hours of adhesion, during which the platelets aggregated.
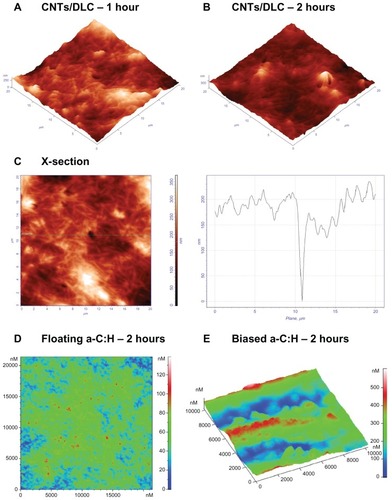
Figure 6 (A) Comparative diagram showing the root-mean-square roughness (Rrms) values of the engineered nanomaterials, after 0, 1 hour, 1.5 hours, and 2 hours of platelet adhesion. (B) Schematic illustration of a time-dependent increase in surface roughness (Rrms) depending on platelet adhesion onto bare carbon and titanium thin films of low nanoroughness. Schematic representations of (C) an increase in Rrms on bare carbon nanotube (CNT)/diamond-like carbon (DLC) nanocoatings due to CNT bundles and (D) a decrease in Rrms during platelet aggregation on the CNT/DLC substrates.
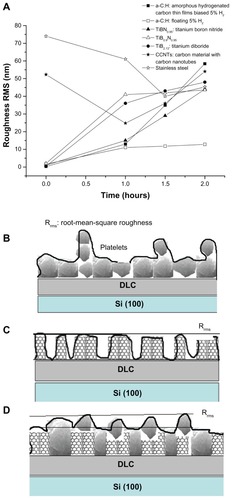
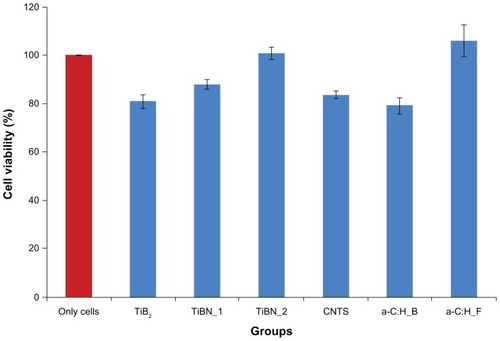
Figure 7 Comparative diagram showing the L929 fibroblasts viability in direct contact with the engineered materials for 24 hours under static conditions.
Abbreviations: a-C:H, amorphous hydrogenated carbon thin films; a-C:H_B, biased amorphous hydrogenated carbon thin films; a-C:H_F, floating amorphous hydrogenated carbon thin films; TiBN, titanium boron nitride; TiBN_1, TiBN0.95; TiBN_2, TiB0.9N0.95; TiB2, titanium diboride; CNTs, carbon nanomaterial with carbon nanotubes; MTT, 3-(4,5-Dimethylthiazol-2-yl)-2,5-diphenyltetrazolium bromide.