Figures & data
Figure 1 Characterization and cellular uptake of RGD-HBc160/ICG. (A) Transmission electron microscopy images of RGD-HBc160/ICG. (B) Diameter distribution of RGD-HBc160/ICG. Representation of absorption spectra (C), and fluorescence emission spectra (D), of free ICG and RGD-HBc160/ICG. (E) Representation of MFI at fluorescence microscopy in MDA-MB-231 and MCF-10A cells following incubation with different RGD-HBc160/ICG concentrations (left), and comparison of MFI (right) at the selected concentration. (F) Representative fluorescence microscopy of MDA-MB-231 and MCF-10A treated with RGD-HBc160/ICG. Representative fluorescence microscopy images from MDA-MB-231 cells after treated with RGD-HBc160/ICG, HBc183/ICG, and ICG (G), and comparison of MFI (H). (I) Comparison of MFI in MDA-MB-231 cells after incubation with RGD-HBc160/ICG and blocking with c(RGDfK) peptides. **P<0.01, ***P<0.001.
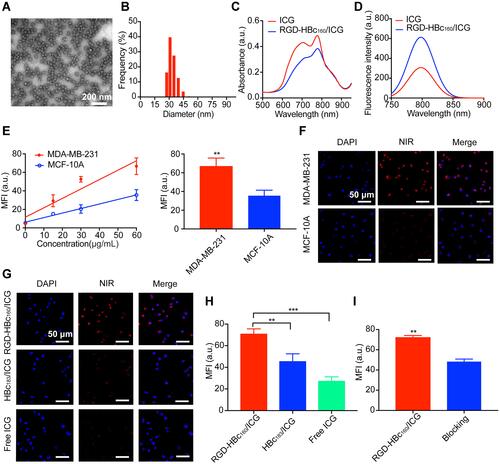
Figure 2 Validation of the target specificity of RGD-HBc160/ICG in subcutaneous breast cancer tumor models. (A) Representative quantification of TBR in MDA-MAB-231 tumor mice as a function of time after intravenous injection with different doses of RGD-HBc160/ICG and comparison of TBR at 36 h time points (B). (C) Representative quantification of TBR in MDA-MAB-231 tumor mice as a function of time after intravenous injection with RGD-HBc160/ICG, HBc183/ICG, ICG, and the Fluorescence images of mice (D). (E) Comparison of specific binding with RGD-HBc160/ICG compared with HBc183/ICG and the free ICG at maximum TBR (right). (F) Fluorescence images from organs and tumors excised at 36 h after injection of RGD-HBc160/ICG, and semi-quantitative analysis of total fluorescence intensity from the samples (G). *P<0.05, **P<0.01.
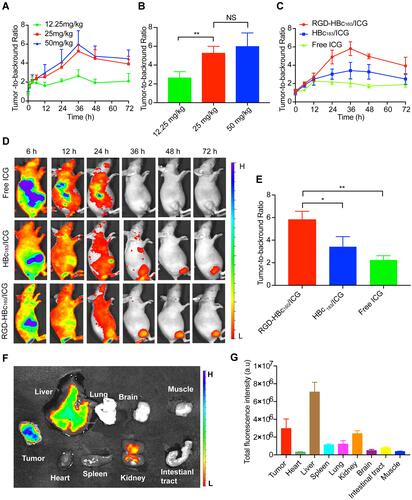
Figure 3 Fluorescent imaging-guided surgical resections of infiltrative MDA-MB-231-luc tumors. (A) The procedure of tumor resection in represented mice guided by white light (WL) plus fluorescence imaging (FL) (blue arrow, residual fluorescence signal in the surgery bed). (B) Ex-vivo fluorescence imaging of excised tissue (red arrow, primary tumor excised under white light only; blue arrow, residual tumor tissue; green arrow, negative surgical margins). (C) Fluorescence image, upper, and H/E stain, lower, for residual tumor tissue and negative margins. (D) Representative preoperative and postoperative bioluminescence images following white light surgery only (n = 10) and white light plus fluorescence-guided surgery (n = 10) with Kaplan-Meier survival analysis of two groups (E).
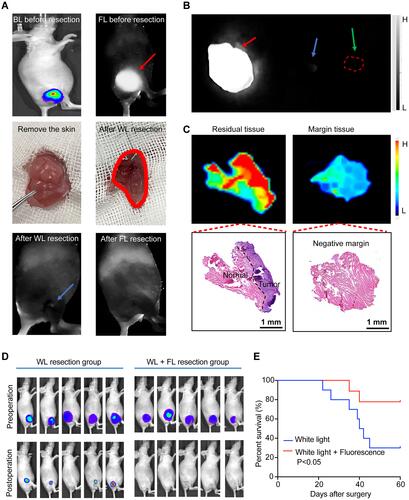
Figure 4 Fluorescence imaging-guided surgical resection in a mammary tumor transgenic model. (A) Simulated negative surgical margins in fluorescence images of combined fourth and fifth mammary glands from an 8-week-old wild-type female mouse. The tissue to be resected is highlighted with a dashed circle. The second row shows representative histological staining of resected portions (P1-4). (B) Simulated positive surgical margins in fluorescence images of combined fourth and fifth mammary glands from an 8-week-old MMTV-PyVT female mouse following the same excision sequence as above. (C) Representative mean fluorescence intensity of tissues with positive and negative surgical margins pooled from the 6 mice. (D) Representation of immunohistochemistry scores for αv-stained breast tissues from MMTV-PyVT and wild-type mice. *P<0.05, ****P<0.0001.
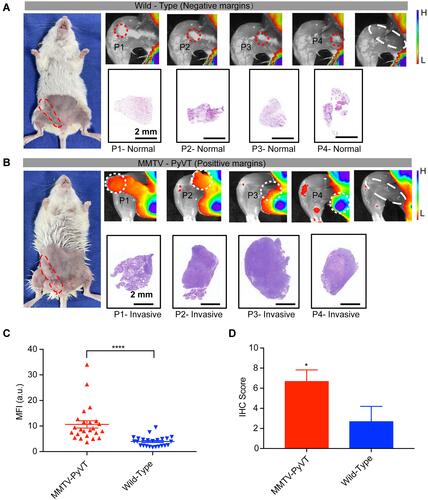
Figure 5 Distribution of the fluorescent probe in the transgenic mouse mammary gland. (A) Schematic illustration of the performance evaluation (left) and the receiver operating characteristic (ROC) curve of fluorescence imaging to differentiate between normal tissues and cancer (right). (B) Microscopic bio-distribution of RGD-HBc160/ICG in breast tissues based on micro-segmentation analyses (left). The upper row shows a representative example of the fluorescence ROI per tissue type based on H/E staining. The lower row shows the corresponding H/E staining image. MFI of all per-tissue type ROIs are shown in the right panel. (C) Ex vivo fluorescent imaging of breast tissue showing corresponding fluorescence intensity (upper), H/E sections (middle), and immunohistochemical stain of αv expression (lower).
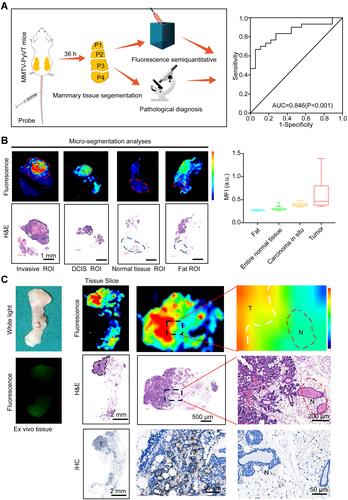
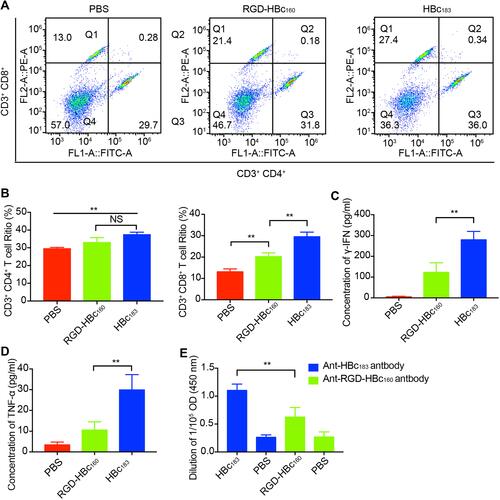
Figure 6 RGD-HBc160 induced immune responses in BALB/c mice. (A) Flow cytometry determination of Ths (CD3+ CD4+) and CTLs (CD3+ CD8+) in the spleen tissue from each group, (B) Quantitative analysis of the means between the different groups. Comparison of the level of serum γ-IFN(C) and TNF-α (D) from RGD-HBc160-immunized, HBc183-immunized, and non-immunized mice. (E) Comparison of the corresponding serum antibody levels from each group on 7 days after the second immunization. **P<0.01.