Figures & data
Figure 1 Transmission electron microscopic image of iron oxide nanoparticles.
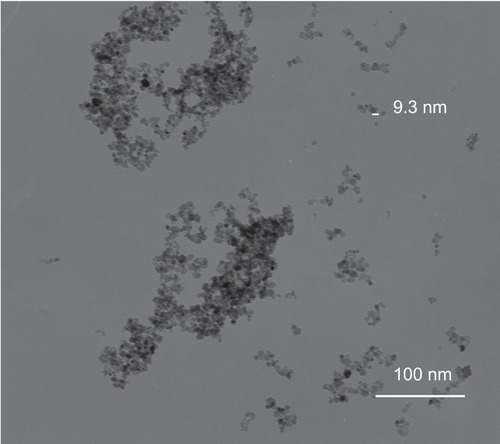
Figure 2 Transmission electron microscopic image of chitosan-coated iron oxide nanoparticles.
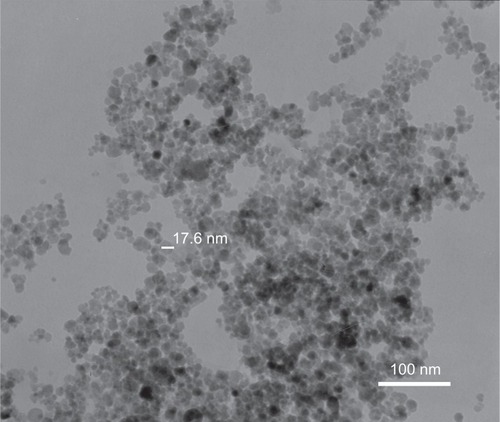
Figure 3 Particle size distribution of iron oxide nanoparticles and chitosan-coated iron oxide nanoparticles by dynamic light scattering.
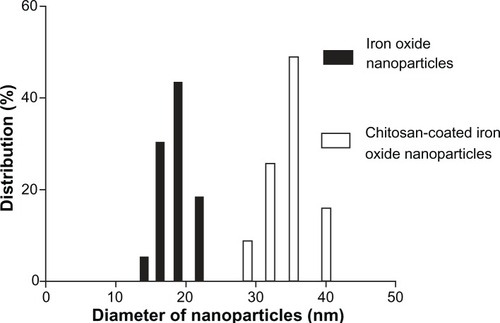
Figure 4 Zeta potential of nanoparticles by a Malvern Zetasizer Nano instrument. (A) Uncoated iron oxide nanoparticles and (B) chitosan-coated iron oxide nanoparticles.
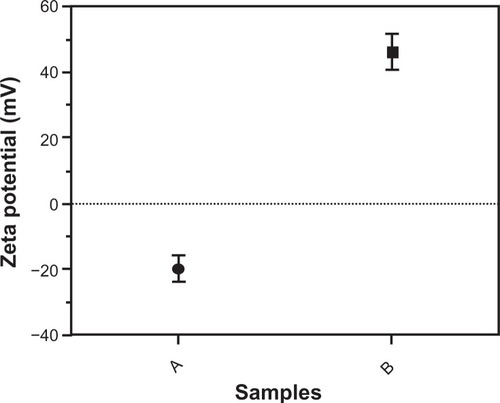
Figure 5 X-ray diffraction results for synthesized nanoparticles. (A) Iron oxide nanoparticles and (B) chitosan-coated iron oxide nanoparticles.
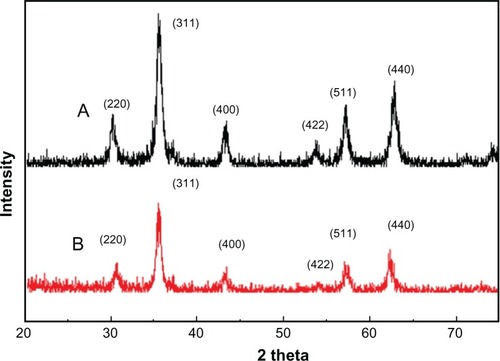
Figure 6 Magnetization curves of chitosan-coated iron oxide nanoparticles as measured by vibrating sample magnetometry at room temperature. (A) Iron oxide nanoparticles and (B) chitosan-coated iron oxide nanoparticles.
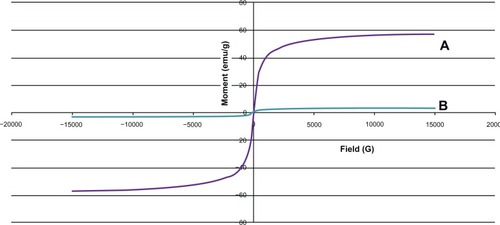
Figure 7 Transmission electron micrographs of Fe3O4 nanoparticle uptake by osteoblasts.
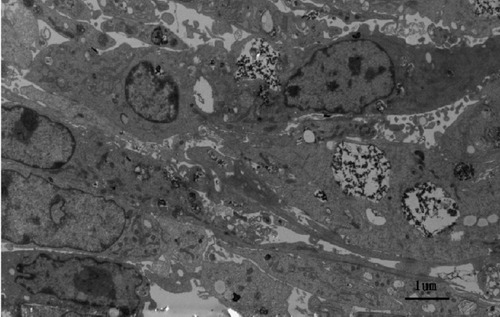
Figure 8 Transmission electron micrographs of chitosan-coated Fe3O4 nanoparticles attached to cell surfaces.
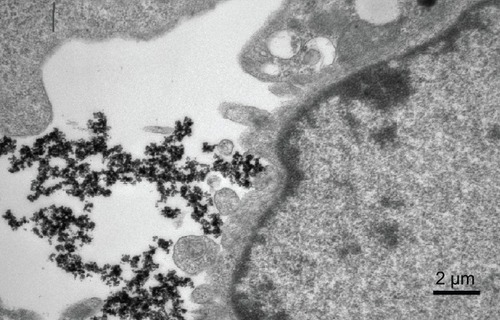
Figure 9 Prussian blue staining of iron in osteoblasts. Osteoblast SV40 incubated with chitosan-coated iron oxide nanoparticles (A) and uncoated iron oxide nanoparticles (B) at a concentration of 200 μg/mL for 24 hours.
Note: Scale bar 50 μm.
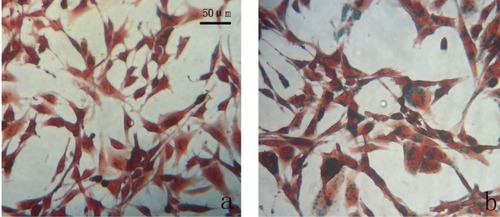
Figure 10 Osteoblast density in the presence of magnetic nanoparticles after one, 3, and 6 days of culture.
Notes: Nanoparticle concentration was 100 μg/mL. Data are shown as the mean ± standard error of the mean (n =4). *P < 0.05 compared with control samples.
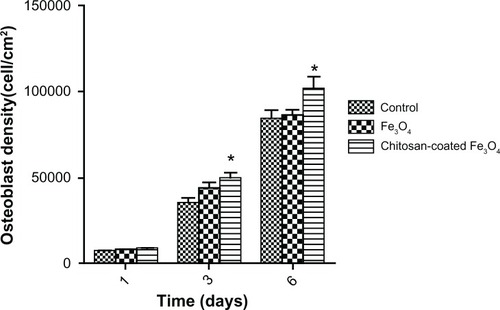
Figure 11 Cell viability of SV40 osteoblasts incubated with different concentrations of nanoparticles after 3 days.
Notes: Data are shown as the mean ± standard error of the mean (n = 4). *P < 0.05 compared with the Fe3O4 group.
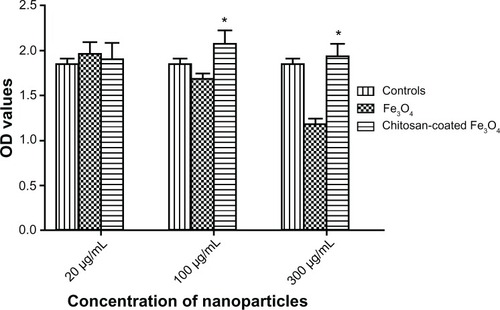
Figure 12 Lactate dehydrogenase assay of osteoblasts incubated with chitosan-coated iron oxide nanoparticles and iron oxide nanoparticles (200 μg/mL) for 3 days and 6 days.
Notes: Data are shown as the mean ± standard error of the mean (n = 4). *P < 0.05 compared with control samples.
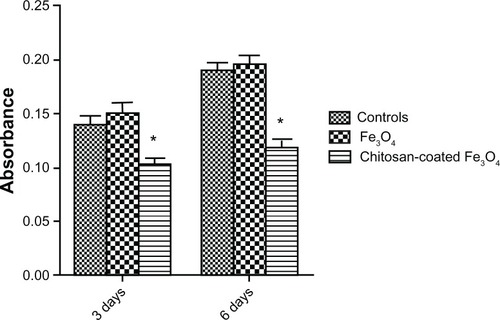
Figure 13 Intracellular total protein synthesis of osteoblasts incubated with chitosan-coated iron oxide nanoparticles and iron oxide nanoparticles (200 μg/mL) for 7, 14, and 21 days.
Notes: Data are shown as the mean ± standard error of the mean (n = 4). *P < 0.05 compared with control samples. Osteoblast seeding density was 100,000 cells/cm2.
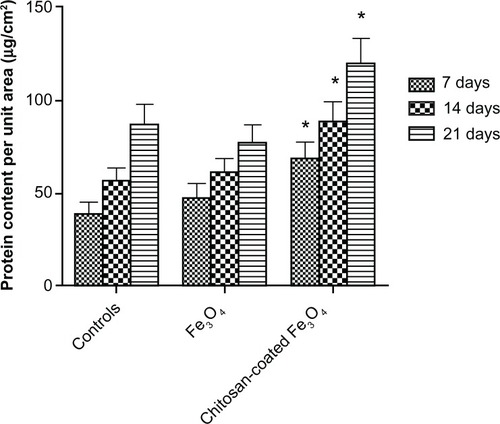
Figure 14 Alkaline phosphatase activity of osteoblasts after 7, 14, and 21 days of culture.
Notes: Data are shown as the mean ± standard error of the mean (n = 4). *P < 0.05 compared with control samples at the same time point; **P < 0.05 compared with the chitosan-coated nanoparticles at the same time point.
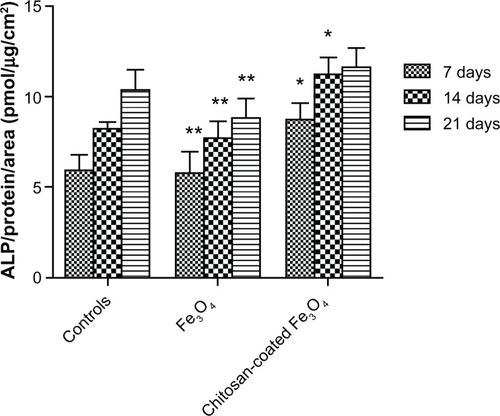
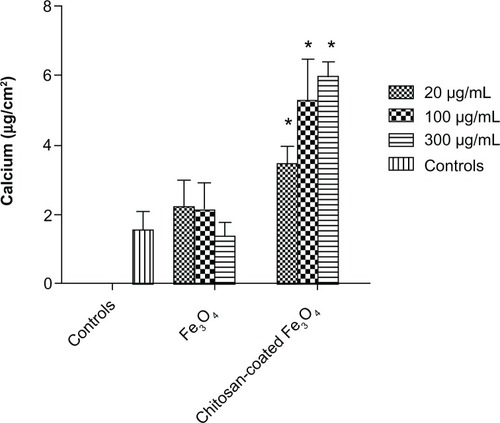
Figure 15 Extra cellular calcium deposition in the presence of nanoparticles of different concentrations after 21 days of culture.
Notes: Data are shown as the mean ± standard error of the mean (n = 4). *P < 0.05 compared with control samples at the same time point.