Figures & data
Figure 1 Crystal appearance of Fe3O4-nanoparticles (SEM).
Abbreviation: SEM, scanning electron microscopy.
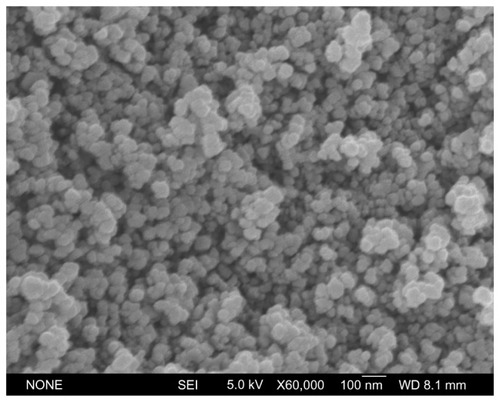
Figure 2 Size distribution of Fe3O4-nanoparticles dispersed in phosphate-buffered saline.
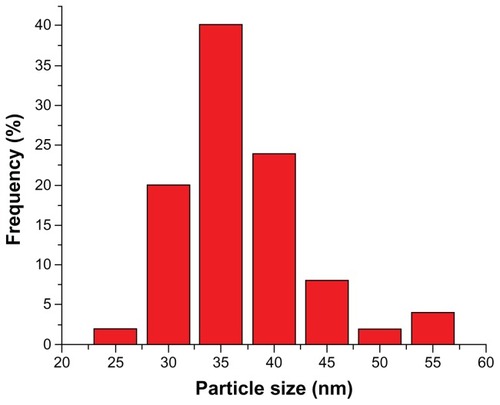
Figure 3 Zeta potential of Fe3O4-nanoparticles.
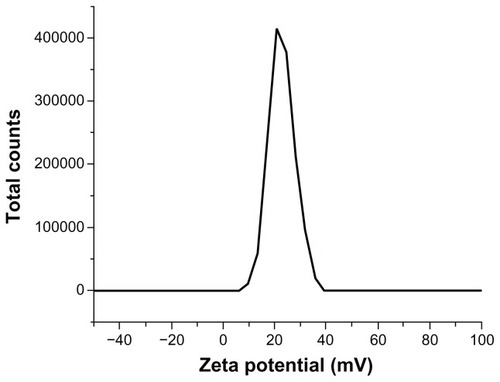
Figure 4 Liver and renal kidney slices (stained with hematoxylin and eosin). Row (A) presents pictures of Liver slices and Row (B) pictures of Kidney slices.
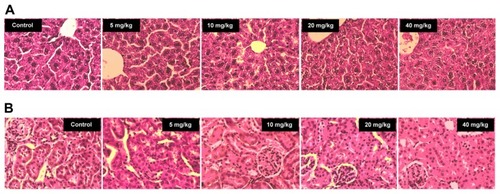
Figure 5 ROS level of liver and kidney homogenates. (A) presents the data of Liver and (B) the data of Kidney.
Notes: Compared with the control group, *indicates 0.01 < P < 0.05, **indicates P < 0.01.
Abbreviation: ROS, reactive oxygen species.
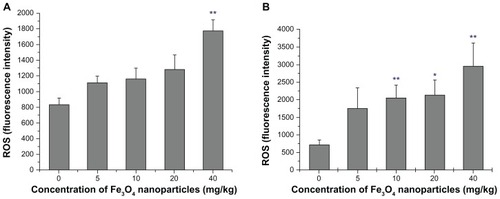
Figure 6 Reduced-GSH level of liver and kidney homogenates. (A) presents the data of Liver and (B) the data of Kidney.
Notes: Compared with the control group, *indicates 0.01 < P < 0.05, **indicates P < 0.01.
Abbreviation: GSH, Glutathione.
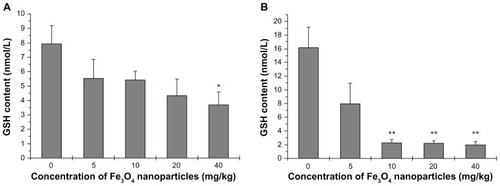
Figure 7 MDA level of liver and kidney homogenates. (A) presents the data of Liver and (B) the data of Kidney.
Notes: Compared with the control group, *indicates 0.01 < P < 0.05.
Abbreviation: MDA, Malondialdehyde.
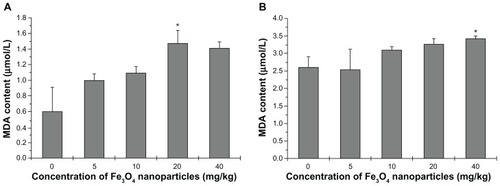
Figure 8 8-OH-dG level of liver and kidney homogenates. (A) presents the data of Liver and (B) the data of Kidney.
Notes: Compared with the control group, *indicates 0.01 < P < 0.05, **indicates P < 0.01.
Abbreviation: 8-OH-dG, 8-hydmxy-2′-deoxyguanosine.
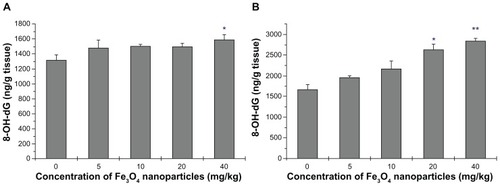
Figure 9 DPC coefficient of liver and kidney homogenates. (A) presents the data of Liver and (B) the data of Kidney.
Notes: Compared with the control group, *indicates 0.01 < P < 0.05, **indicates P < 0.01.
Abbreviation: DPC, DNA-Protein Crosslinks.
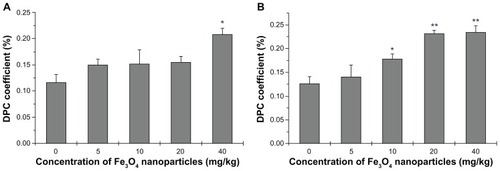
Figure 10 Outline of experiment procedures.
Abbreviations: 8-OH-dG, 8-hydmxy-2′-deoxyguanosine; DPC, DNA-Protein Crosslinks; MDA, Malondialdehyde; ROS, reactive oxygen species; GSH, Glutathione.
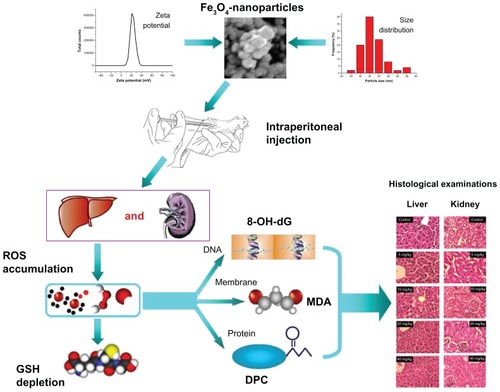
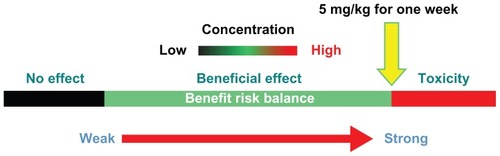
Figure 11 Expected safe dose of Fe3O4-nanoparticles for sub-long-term systematic delivery.