Figures & data
Figure 1 Suspensions of bulk drugs and naked coenzyme Q10 nanocrystals of different sizes after storage for 2 days at room temperature.
Notes: From left to right: bulk drugs, nanocrystals of 80 nm, 120 nm, 400 nm, and 700 nm, respectively. The drug content of all five formulations was about 1 mg/mL.
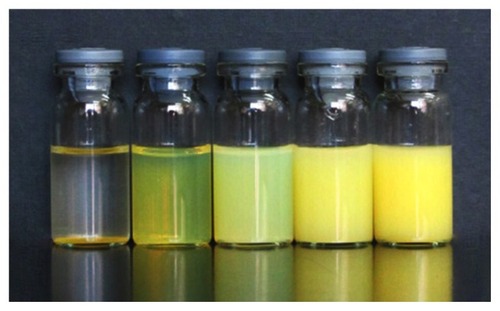
Table 1 Particle size, polydispersity index, and zeta potential of coenzyme Q10 nanocrystals (n = 4)
Figure 2 Physical stability of the suspensions of naked coenzyme Q10 nanocrystals at room temperature (n = 3).
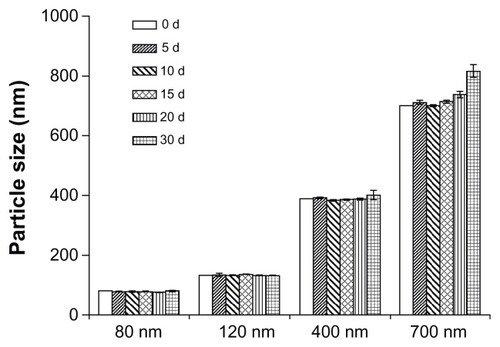
Figure 3 Transmission electron micrographs of coenzyme Q10 nanocrystals with particle sizes of (A) 80 nm, (B) 120 nm, (C) 400 nm, and (D) 700 nm.
Note: Bar = 500 nm.
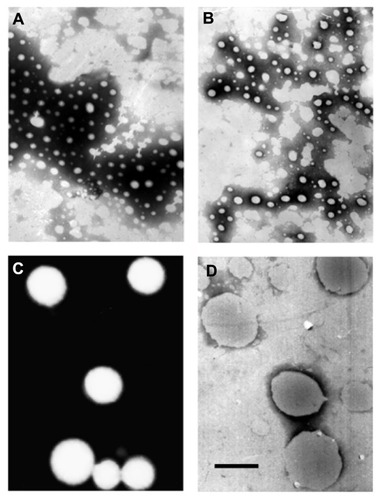
Figure 4 Differential scanning calorimetry patterns of suspensions of coenzyme Q10 nanocrystals of different sizes and coarse suspensions.
Notes: (A) Coarse suspensions; (B) 80 nm, (C) 120 nm, (D) 400 nm, (E) 700 nm; (F) coarse suspensions after storage for 4 hours; (G) 50-fold concentrated 120 nm nanocrystal suspensions.
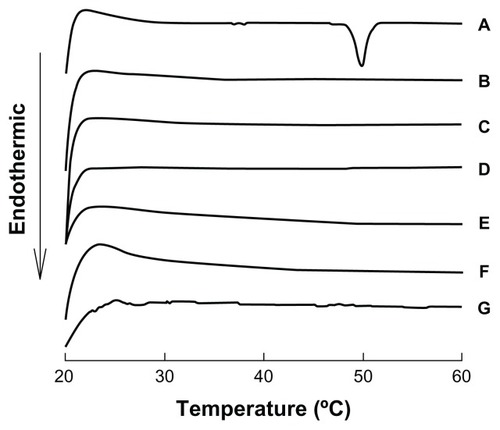
Figure 5 Differential scanning calorimetry patterns of dried suspensions of coenzyme Q10 nanocrystals of different sizes and coarse suspensions.
Notes: (A) Coarse suspensions; (B) 80 nm, (C) 120 nm, (D) 400 nm, (E) 700 nm; (F) 50-fold concentrated 120 nm nanocrystal suspensions.
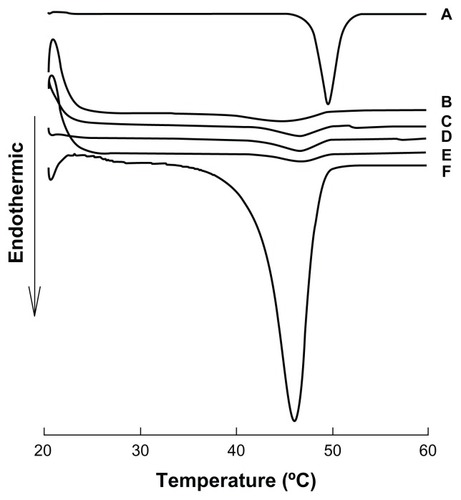
Figure 6 Kinetic solubility of coenzyme Q10 at different drug contents ranging from about 0.03 mg/mL to 0.33 mg/mL.
Notes: Results are expressed as the mean ± standard deviation of three replicates. ● = 0.03 mg/mL; ♦ = 0.10 mg/mL; ▲ = 0.17 mg/mL; ♦ = 0.33 mg/mL. Solid line: placed horizontally; dotted line: placed vertically.
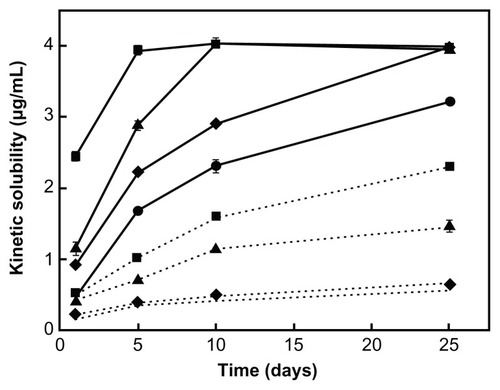
Figure 7 Kinetic solubility of coenzyme Q10 nanocrystals and bulk drugs from the suspensions in three types of dissolution medium. Experiments were performed at 100 rpm and 25°C, and samples were placed horizontally for agitation. The drug content was about 0.33 mg/mL in every case. The results are expressed as the mean ± standard deviation of three replicates. (A) Distilled water containing 1.3% w/v Tween 20, (B) distilled water containing 1.3% w/v Tween 20 and 5.0% v/v isopropanol, and (C) distilled water containing 1.3% w/v Tween 20 and 10.0% v/v isopropanol.
Notes: Solid bar: passed through a three-layer membrane filter (the pore size from the top to bottom layer being 0.1 μm, 0.05 μm, and 0.1 μm); dashed bar: passed through a one-layer 0.05 μm Millipore filter.
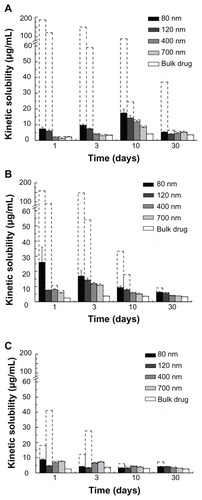
Figure 8 Solubilization model of nanocrystals and bulk drugs. (A) Solubilization process; (B) solubilization curves.
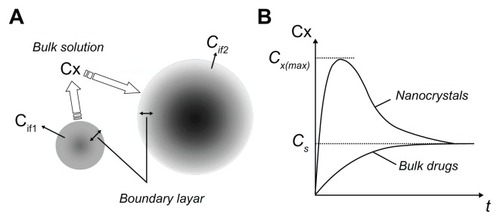
Table 2 Size and size distribution of different coenzyme Q10 nanocrystals after dissolution in three types of dissolution medium for different predetermined timesTable Footnote*
Figure 9 Dissolution profiles of coenzyme Q10 nanocrystals and bulk drugs from the suspensions in three types of dissolution medium. (A) Distilled water containing 1.3% w/v Tween 20, (B) distilled water containing 1.3% w/v Tween 20 and 5.0% v/v isopropanol, and (C) distilled water containing 1.3% w/v Tween 20 and 10.0% v/v isopropanol.
Notes: The dissolution study was performed at 100 rpm and 25°C. About 0.6 mg of coenzyme Q10 was used in 900 mL of dissolution medium. The results are expressed as the mean ± standard deviation of three replicates. ● = 80 nm; ○ = 120 nm; ▲ = 400 nm; △ = 700 nm; ■ = bulk drugs.
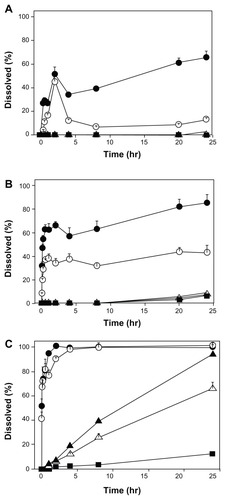
Table 3 Pharmacokinetic parameters obtained after oral administration of different coenzyme Q10 nanocrystal suspensions, coarse suspensions, and capsules (n ≥ 4)Table Footnotea
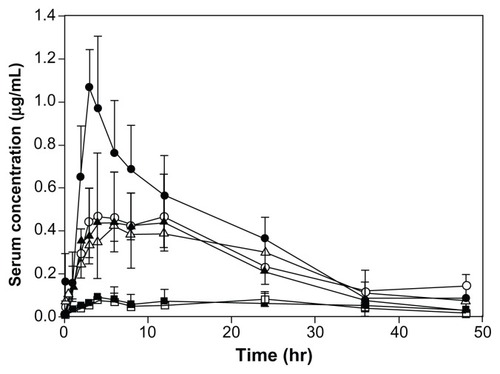
Figure 10 Serum concentration–time profiles of coenzyme Q10 after oral administration of different suspensions and capsules at doses of 60 mg/body in beagle dogs.
Notes: Results are expressed as the mean, with the bars showing the standard deviation values. ● = 80 nm nanocrystal suspensions; ○ = 120 nm nanocrystal suspensions; ▲ = 400 nm nanocrystal suspensions; △ = 700 nm nanocrystal suspensions; ■ = capsules; □ = coarse suspensions (n ≥ 4).