Figures & data
Scheme 1 Schematic diagram for preparation of iRGD-PSS@PBAE@JQ1/ORI NPs by nanoprecipitation method (A) and iRGD-PSS@PBAE@JQ1/ORI NPs synergistic mechanisms against breast cancer (B).
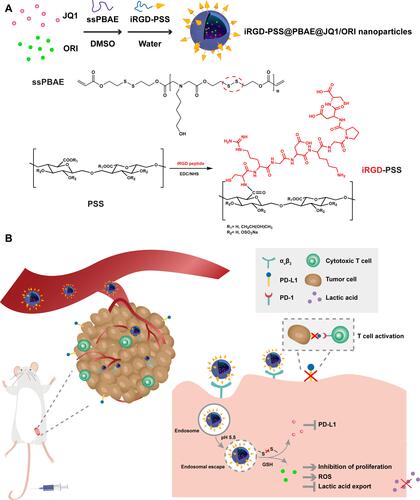
Figure 1 Characterization and properties of iRGD-PSS@PBAE@JQ1/ORI NPs in vitro. (A) The IR spectra of iRGD-PSS@PBAE@JQ1/ORI NPs. (B) The 1H-NMR spectra of iRGD-PSS@PBAE@JQ1/ORI NPs. (C) The morphology of iRGD-PSS@PBAE@JQ1/ORI NPs observed by the TEM. (D) The size distribution of iRGD-PSS@PBAE@JQ1/ORI NPs detected by the dynamic laser scattering method. (E) The changes of size and PDIs of iRGD-PSS@PBAE@JQ1/ORI NPs during storage in PBS supplemented with/without 10% FBS. (F and G) The releases of JQ1 (F) and ORI (G) from iRGD-PSS@PBAE@JQ1/ORI NPs in vitro at different pH values (pH 5.5, 6.5, 7.4) and with/without 10 mM DTT.
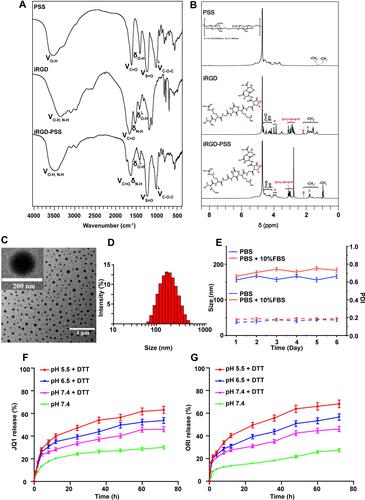
Figure 2 Cellular uptakes and penetrating ability of IR780 encapsulated NPs. (A) Confocal images of the cells after incubation with free IR780, PSS@PBAE@IR780 and iRGD-PSS@PBAE@IR780 NPs for 2 h (Scale bar: 20 µm). (B) Quantitative analyses of intracellular IR780. (C) Confocal images of 4T1 tumor-like spheroids after 2-hour, 6-hour and 12-hour incubation with free IR780, PSS@PBAE@IR780 and iRGD-PSS@PBAE@IR780 NPs (Scale bar: 100 µm). (D) Relative fluorescence areas (RFAs) of IR780 in 4T1 tumor spheroids after various treatments. ##P<0.01 between two treatment groups. *P<0.05 for comparison with the IR780 group.
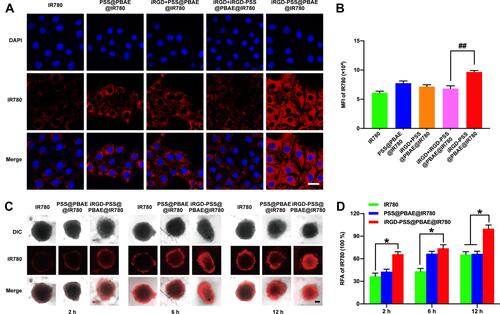
Figure 3 Inhibition of iRGD-PSS@PBAE@JQ1/ORI NPs on the growth of breast cancer cells. The cytotoxicities of free JQ1, ORI, PSS@PBAE@JQ1/ORI and iRGD-PSS@PBAE@JQ1/ORI NPs in 4T1 cells after 24-hour treatments (A) and 48-hour treatments (B) at different JQ1 concentrations. (C) The LIVE/DEAD analysis of cells at 24 h after various treatments (Scale bar: 200 µm). (D) Cell apoptosis was quantified by flow cytometry at 24 h after various treatments (Q1: dead cells; Q2: late apoptotic cells; Q3: early apoptotic cells; Q4: live cells).
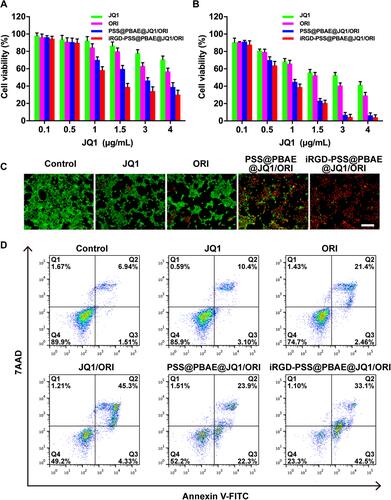
Figure 4 Effects of iRGD-PSS@PBAE@JQ1/ORI NPs on the production of intracellular ROS, ICD-induced immune priming and lactic acid secretion. The confocal images (A) and the flow cytometric analysis (B) of intracellular ROS productions in 4T1 cells at 24 h after various treatments (Scale bar: 20 µm). The confocal images (C) and the flow cytometric analysis (D) of CRT exposure levels in 4T1 cells at 24 h after various treatments (Scale bar: 20 µm). (E) The production of lactic acid in 4T1 cells at 24 h after various treatments. (F) The flow cytometric analysis of inhibition on DC maturation at 24 h after various treatments. (G) PD-L1 expression in 4T1 cells after various treatments. ##P<0.01 between two treatment groups. *P<0.05 and **P<0.01 for comparison with the control group.
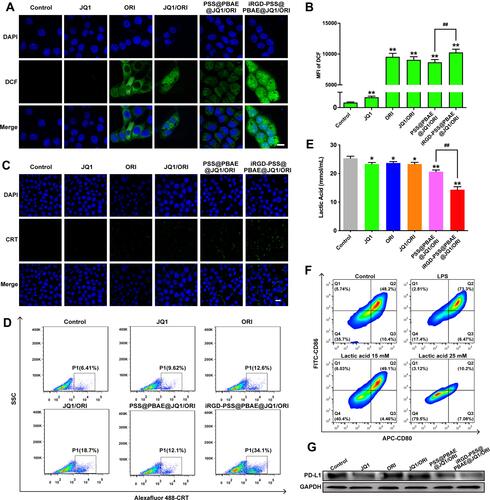
Figure 5 Biodistribution and tumor accumulation studies in 4T1 tumor-bearing mice. (A) The in vivo imaging photos of mice at different times after administrations. Tissue distribution and tumor-accumulation of IR780 encapsulated NPs in 4T1 tumor-bearing mice. (B) The fluorescent images of major organs and tumor tissues were removed from the mice at 48 h after intravenous injections of normal saline (the control), free IR780, PSS@PBAE@IR780 and iRGD-PSS@PBAE@IR780 NPs. (C) The comparisons of chemiluminescence image’s average radiant efficiency detected from major organs and tumor tissues at 48 h after administrations. ** indicate P<0.01 for comparison with the PSS@PBAE@IR780 NPs group. (D) The confocal images of intratumoral localization of IR780 encapsulated NPs at 24 h after various treatments. (E) The confocal images of intratumoral ROS generation after various treatments (Scale bar: 100 µm).
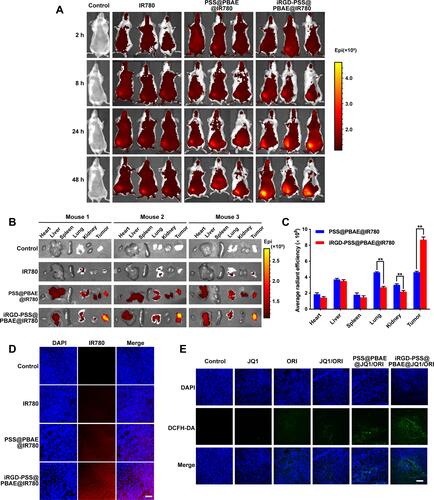
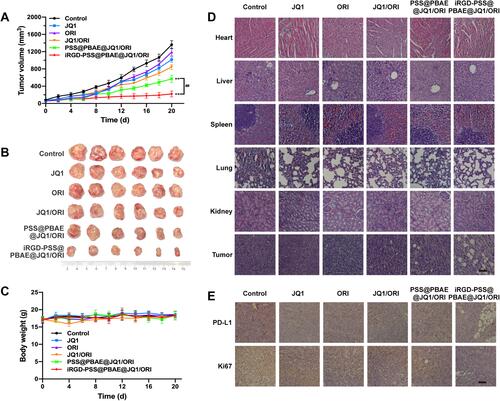
Figure 6 Inhibition of iRGD-PSS@PBAE@JQ1/ORI NPs on the growth of breast cancer in 4T1 tumor-bearing mice. The curves of tumor growth (A) and the photograph of tumors (B) in the mice with treatments of normal saline (the control), JQ1, ORI, JQ1/ORI mixture, PSS@PBAE@JQ1/ORI and iRGD-PSS@PBAE@JQ1/ORI NPs. (C) The changes of mouse body weights during the whole treatment period. (D) The microscopic images of H&E stained sections of tumors and major organs were removed from the mice with different treatments (Scale bar: 100 µm). (E) The microscopic images of tumor sections with staining of PD-L1 and Ki67 (Scale bar: 100 µm). ##P<0.01 between two treatment groups. **P<0.01 for comparison with the control group.