Figures & data
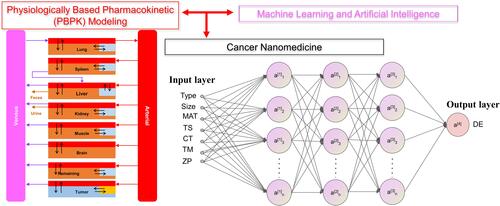
Table 1 Summary of Modeling Algorithms Used in This Study
Table 2 List of Variables and Its Levels/Values in the Tumor-Nano Database
Figure 1 Overview of the study framework to develop machine learning and deep learning models to predict delivery efficiency of nanoparticles to the tumor site in tumor-bearing mice. X represents the initial input variables and W represents the variables after feature selections.
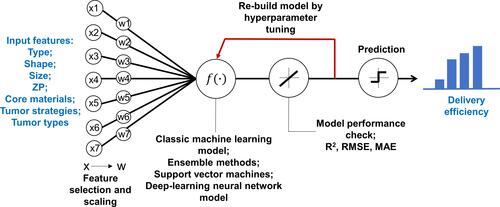
Figure 2 Overview of the Nano-Tumor Database. (A–C) Percentages of data related to cancer therapy scenarios based on the Targeting Strategy (TS), Cancer Type (CT), and Tumor Model (TM). (D–H) Percentages of data that were categorized based on the physicochemical properties of the studied nanoparticles, including the type (D), the shape (E), the core (F), the log-transformed hydrodynamic diameter (G), and Zeta potential (H). In Panel H, Zeta potential values are presented using box whisker plots across 2.5th, 25th, 50th, 75th, and 97.5th percentiles. Data in the Nano-Tumor Database are from Cheng et al.Citation5
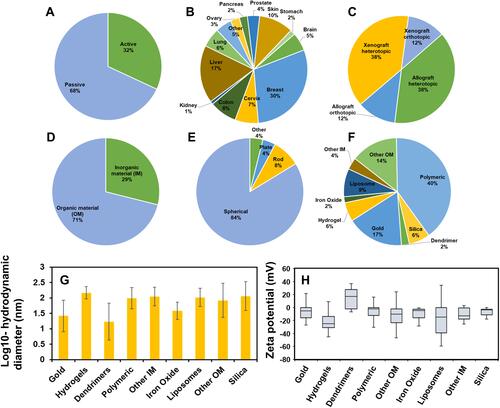
Table 3 Five-Fold Cross-Validation and Testing Results for Tumor Delivery Efficiency Using Different Machine Learning and Deep Learning Models
Figure 3 Correlation between values from the Nano-Tumor Database and the deep neural network model-predicted values for (A) DEmax, (B) DE24, (C) DE168 and (D) DETlast. Root mean square error (RMSE) and coefficient of determination (R2) in the training set and test set are shown. RMSE_train and R2_train represent the best performance of RMSE and R2 values in the training set, while RMSE_test and R2_test represent the values for external validation. DEmax, DE24, DE168 and DETlast represent the maximum tumor delivery efficiency (DE), DE at 24 h, 168 h, and the last sampling time, respectively.
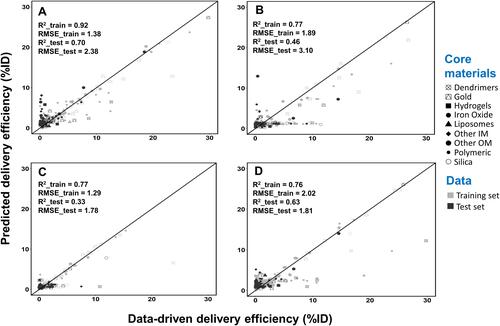
Figure 4 Correlation between values from the Nano-Tumor Database and the predicted values based on the simple linear regression model for (A) DEmax, (B) DE24, (C) DE168 and (D) DETlast. Root mean square error (RMSE) and coefficient of determination (R2) in the training set and test set are shown. RMSE_train and R2_train represent the best performance of RMSE and R2 values in the training set, while RMSE_test and R2_test represent the values for external validation. DEmax, DE24, DE168 and DETlast represent the maximum tumor delivery efficiency (DE), DE at 24 h, 168 h, and the last sampling time, respectively.
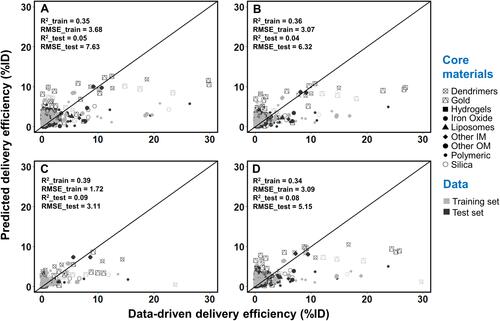
Figure 5 Correlation between values from the Nano-Tumor Database and the predicted values based on the random forest model for (A) DEmax, (B) DE24, (C) DE168 and (D) DETlast. Root mean square error (RMSE) and coefficient of determination (R2) in the training set and test set are also shown. RMSE_train and R2_train represent the best performance of RMSE and R2 values in the training set, while RMSE_test and R2_test represent the values for external validation. DEmax, DE24, DE168 and DETlast represent the maximum tumor delivery efficiency (DE), DE at 24 h, 168 h, and the last sampling time, respectively.
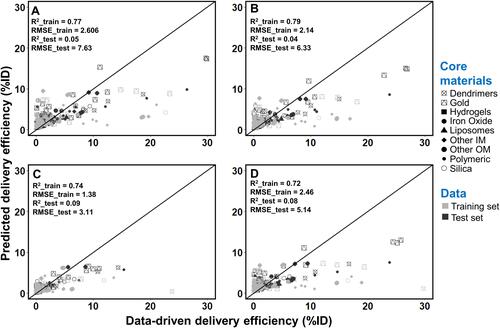
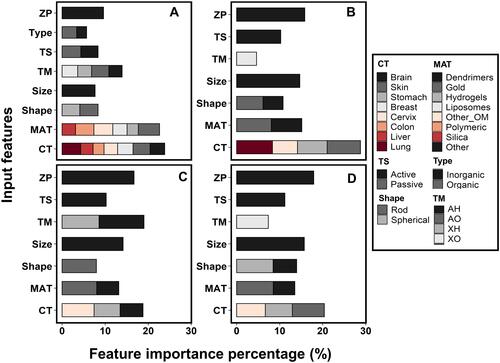
Figure 6 Importance percentage in the deep learning model for each feature variable. (A–D) represent results for the feature variable of DEmax, DE24, DE168 and DETlast, respectively. Individual importance is represented by colors in the stacked bars.