Figures & data
Scheme 1 Schematic for the synthesis of iron oxide nanoparticles (IONPs)-embedded poly(lactic acid) (PLA) magnetic nanocomposites (MNCs) via oil-in-water emulsion by differing the contents of IONPs in the MNCs.
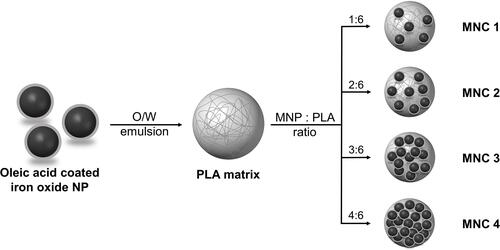
Figure 1 Characterization of the synthesized oleic acid-coated IONPs. (A) A TEM image of the IONPs. (B) A size distribution of the IONPs measured by DLS. (C) Magnetization curve of the IONPs. (D) Temperature increases of the sample solutions containing various amounts of IONPs under the AMF (H = 3.25 kA/m and f = 191 kHz).
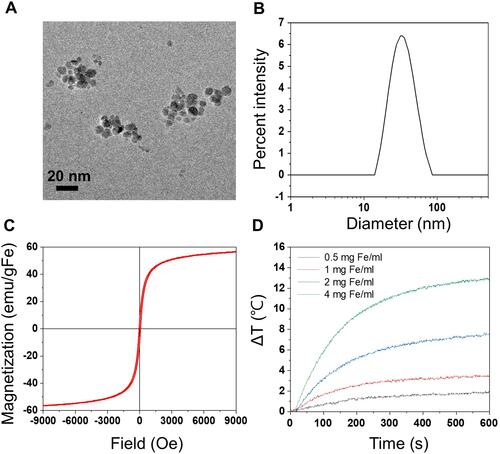
Table 1 The Nomenclatures, Compositions, and Dimension of Various MNCs
Figure 2 Characterization of the IONPs-embedded nanocomposites (MNCs). (A) TEM images of various MNCs. (B) Size distribution of MNCs. (C) Percent of Iron contents in MNCs (n=3).
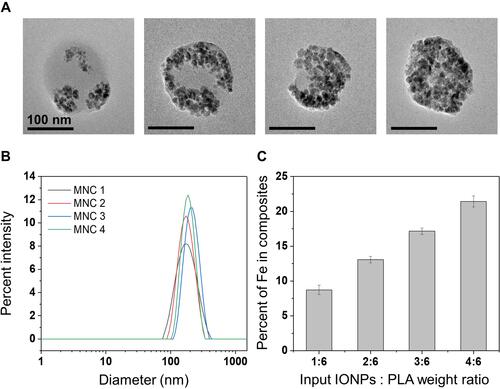
Figure 3 Magnetic properties of IONPs and various MNCs. (A) Magnetization of IONPs and MNCs. (B) Saturation magnetization (Ms) and (C) Hysteresis loss areas of IONPs and MNCs.
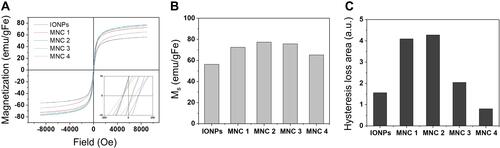
Figure 4 Heating efficiency of IONPs and MNCs. Heating efficiency was demonstrated as SLP values per gFe. (A) SLP values of IONPs and various MNCs at 1 mgFe/mL concentration in 1-octanol. (B) SLP values of IONPs and MNC2 at different concentrations in 1-octanol. (C) SLP of MNCs and Resovist® at 4 mgFe/mL concentration in aqueous solution.
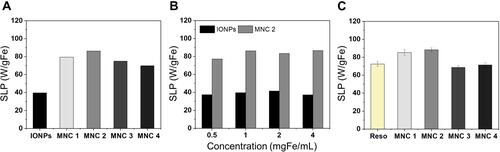
Figure 5 Effects of AMF on heating efficiency of MNCs. (A) Influence of amplitude (1.6–3.2 kA/m) on heat generation of various MNCs. (B) Influence of the amplitude (15–45 kA/m) on heat generation of MNC2. (C) Influence of frequency (160–382 kHz) on heat generation of MNC2. All experiments were performed at the sample IONP concentration (1 mgFe/mL).
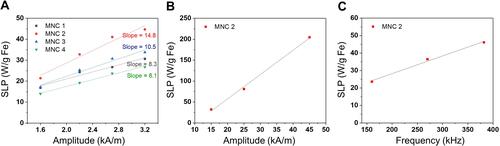
Figure 6 Stability tests of MNC2 and Resovist®. (A) Photographs of the MNC2 (left) and Resovist® (right) during the incubation in PBS or DMEM. (B) Hydrodynamic diameters of MNC2 and Resovist® during the incubation in PBS and media for 48 h. (C) SLP values before and after the 48 h incubation in DMEM medium.
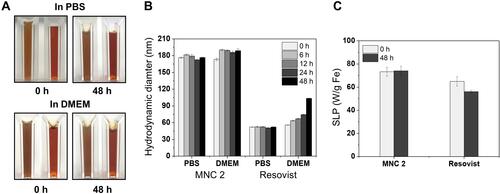
Figure 7 Cytocompatibility tests of the MNC2 and Resovist® with NIH-3T3 cells. (A) Fluorescence micrographs of the cells after the incubation with MNC2 and Resovist® at different concentrations for 1 d. The green and red cells in the images indicate live and dead cells, respectively. Scale bars are 100 μm. (B) Percent viability of the cells cultured with various samples for 1 d. An asterisk *Indicates the statistical significance between two groups (p < 0.05).
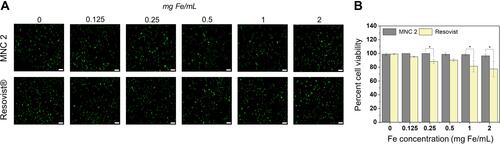
Figure 8 Biodistribution of MNC after intravenous injection. (A) In vivo fluorescence images of the mice acquired after 0, 4, 8, 12, 24, and 48 h of MNC injection. (B) Fluorescence images of the main organs after 24 h and 48 h of injection. (C) Fluorescence intensities of the individual organs harvested at 24 h and 48 h after injection of MNC.
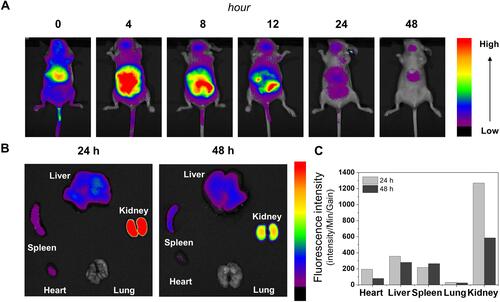
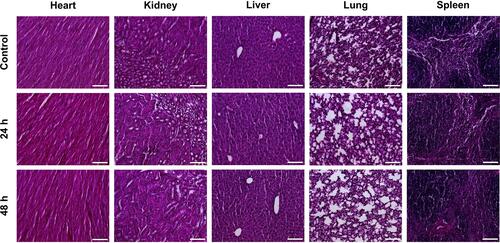
Figure 9 Histological images of main organs (heart, kidney, liver, lung, and spleen) after 24 h and 48 h of MNC injection and the untreated control group. Scale bar = 100 μm.