Figures & data
Scheme 1 Construction of minocycline (MC)-loaded poly(α-lipoic acid)–methylprednisolone (MP) prodrug nanoparticles (MC-PαLA-MP NPs). (A) Synthesis of PαLA-MP. (B) Self-assembly of MC-PαLA-MP NPs. (C) Intravenous injection of MC-PαLA-MP NPs to treat traumatic spinal cord injury (TSCI) rats. (D) Microenvironment-responsive drug release and the mechanism of phased inflammation inhibition after TSCI.
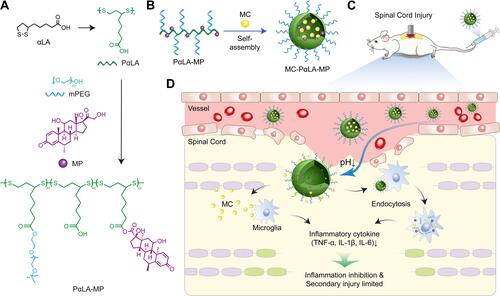
Figure 1 Physical characterization and in vitro release kinetics of MC-PαLA-MP NPs. (A) Dynamic light scattering (DLS) measurement of MC-PαLA-MP NP size distribution. (B) Transmission electron microscopy (TEM) image of MC-PαLA-MP NPs revealing a spherical shape of approximately 60 nm mean diameter. Scale bars are 200 and 50 nm, respectively(C) Minocycline (MC) release from MC-PαLA-MP NPs in the aqueous medium. (D) Methylprednisolone (MP) release from MC-PαLA-MP NPs in the aqueous medium.
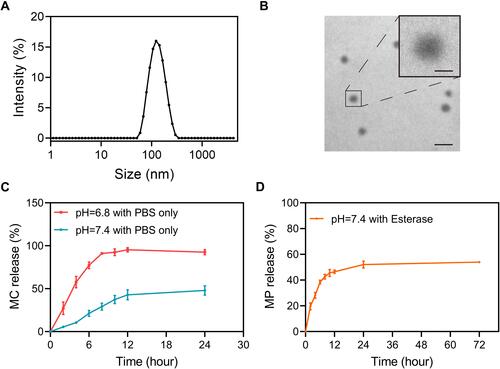
Figure 2 Cellular uptake efficiency of Cy5-labeled PαLA-MP NPs. (A and B) Confocal laser scanning microscopy (CLSM) images of (A) BV2 microglial and (B) PC12 cells after incubation with Cy5-PαLA-MP NPs for 1, 2, or 4 h. (C and D) Semiquantitative analysis of Cy5 fluorescence intensity in (C) BV2 and (D) PC12 cells from CLSM images. (E and F) Flow cytometry analysis (FCA) results of Cy5 uptake into (E) BV2 and (F) PC12 cells incubated with Cy5-PαLA-MP NPs for 1, 2, or 4 h. (G and H) Cy5 fluorescence intensity in (G) BV2 and (H) PC12 cells measured using semiquantitative FCA.
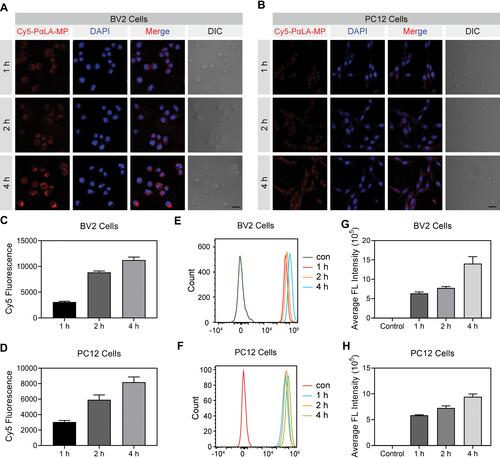
Figure 3 In vitro biocompatibility and anti-inflammatory efficacy of MC-PαLA-MP NPs. (A–C) Viabilities of (A) astrocytes, (B) BV2 microglial cells, and (C) PC12 cells after incubation with different concentrations of PαLA-MP NPs or MC-PαLA-MP NPs. (D–F) Release rates of (D) TNF-α, (E) IL-1β, and (F) IL-6 from lipopolysaccharide-activated BV2 cells treated with the vehicle (phosphate buffer saline), MC-PαLA-MP NPs, or various NP components. ****p < 0.0001; ***p < 0.001; **p < 0.01.
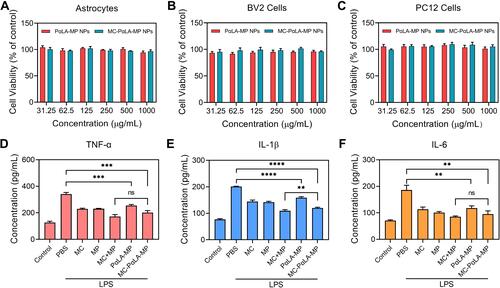
Figure 4 Facilitated recovery of the hind limb motor function by MC-PαLA-MP NPs. (A) Basso, Beattie, Bresnahan (BBB) scores of TSCI rats receiving the indicated treatments. (B) Final BBB scores at 8 weeks after injury. ****p < 0.0001; **p < 0.01.
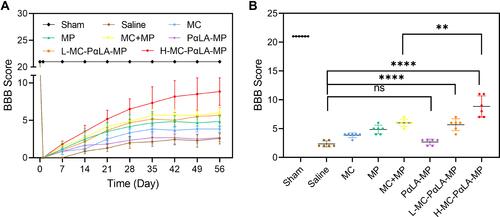
Figure 5 Histopathological changes induced by TSCI and mitigation by MC-PαLA-MP NPs. (A) Images of injured spinal cord stained with hematoxylin and eosin (H&E). Low magnification images are on the left (2×), and higher magnification images of the boxed regions are on the right (20×). Scale bars are 500 and 50 μm, respectively. (B) Immunofluorescence staining for the astrocyte marker glial fibrillary acid protein (red) and the neuronal marker NF200 (green) in the injured spinal cord. Low magnification images (2×) are on the left, and higher magnification images (10×) on the right. Scale bars are 500 and 100 μm, respectively. Arrows indicated the pathological characteristics.
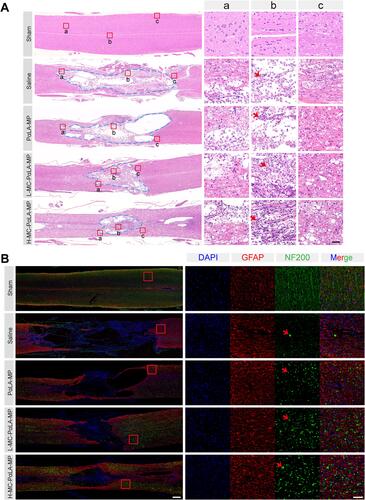
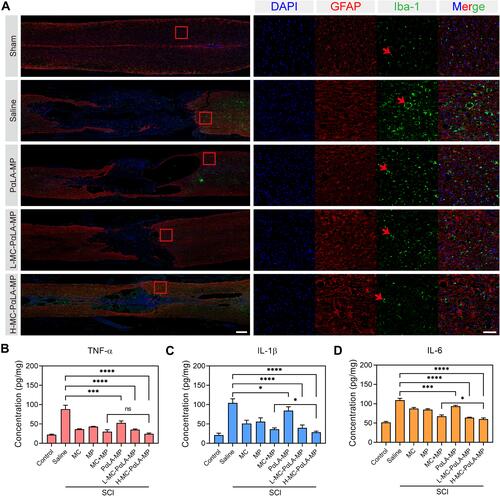
Figure 6 Treatment of TSCI rats with intravenous MC-PαLA-MP NPs significantly reduced microglial activation, astrocyte activation, and production of pro-inflammatory cytokines at the injury site. (A) Immunofluorescence images of activated astrocytes (glial fibrillary acid protein-positive, red) and microglia (Iba1-positive, green) in the injured spinal cord. Low magnification images (2×) are on the left, and higher magnification images (10×) of the outlined areas are on the right. Scale bars are 500 and 100 μm, respectively. Arrows indicated the pathological characteristics. (B–D) Immunoexpression of (B) TNF-α, (C) IL-6, and (D) IL-1β in the spinal cord of TSCI rats receiving the indicated treatments. ****p < 0.0001; ***p < 0.001; *p < 0.05.