Figures & data
Figure 1 Features of protein constructs containing peptidic CXCR4 ligands. (A) Schematic representation of CXCR4-binding constructs indicating their modular composition. A linker (yellow box) commonly used in phage display was inserted between the protein ligand (L, blue) and eGFP (green). The amino acid sequences of the four ligands are shown. In all cases, an additional amino terminal methionine, derived from the cloning strategy adapted to Escherichia coli was expected. (B) Predicted structure of the different GFP-derived constructs. The color code of panel A is maintained here for both ligand- (blue) and H6- (red) overhanging ends.
Abbreviation: GFP, green fluorescent protein.
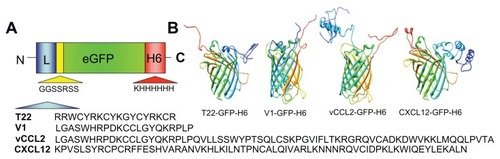
Figure 2 Biochemical characterization of protein constructs upon protein purification.
Notes: Mass spectrometry of the purified constructs indicating the experimental molecular weight. The obtained N-terminal sequence is also shown, always coincident with the predicted sequence (). Protein integrity is also shown through Coomassie blue-stained sodium dodecyl sulfate polyacrylamide gel electrophoresis gels (Co) and by H6 immunodetection in Western blot (WB).
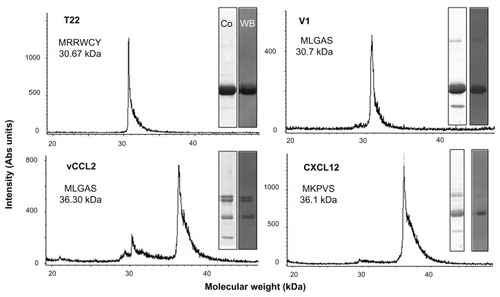
Figure 3 Differential internalization of CXCR4 ligands.
Notes: Internalization of T22-GFP-H6 and alternative constructs in HeLa cells, monitored by flow cytometry 24 hours after exposure.
Abbreviation: GFP, green fluorescent protein.
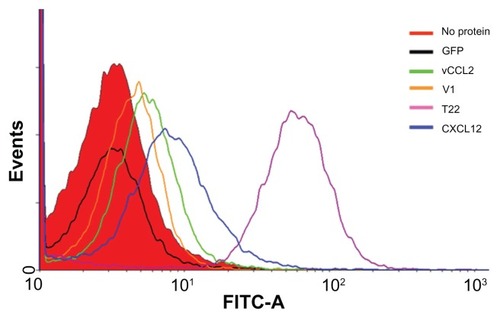
Figure 4 Differential internalization and intracellular trafficking of CXCR4 ligands. (A) Confocal images of HeLa cells exposed to differently tagged proteins for 24 hours. Nuclei are labeled in blue and cell membranes in red. Bar indicates 20 μm. (B) Detail of a HeLa cell exposed to T22-GFP-H6, showing the intracellular localization of nanostructured, fluorescent entities, in an isosurface representation within a three-dimensional volumetric x-y-z data field. (C) Yellow spots in the cell membrane, marked with an arrow, indicate early endosomal localization of green fluorescent particles (merging of red and green signals). In the insets, details of endosome-embedded fluorescent particles dissected by three-dimensional reconstruction. (D) Intracellular tracking of individual fluorescent particles monitored by confocal microscopy. (E) Time course monitoring of T22-GFP-H6 internalization in HeLa cells by flow cytometry.
Abbreviation: GFP, green fluorescent protein.
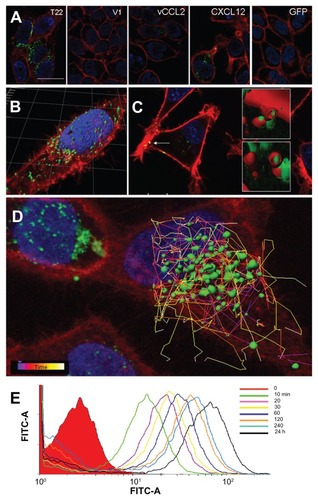
Figure 5 Internalization of T22-GFP-H6 in SW1417 cells. (A) Isosurface representation of T22-GFP-H6-exposed SW1417 cells within a three-dimensional volumetric x-y-z data field. (B) The particulate nature of the protein and the perinuclear accumulation are clearly observed. (C) Isosurface representation of GFP-H6-exposed SW1417 cells showing lack of fluorescence. (D) MTT analysis of SW1417 cells exposed to different concentrations of T22-GFP-H6. As a control, we used determined viability of cells exposed to the storing buffer alone. Values are referred to cell viability of cultures not exposed to the buffer. (E) Dose-response curve of T22-GFP-H6 internalization in HeLa and SW1417 cells. Data adjusted to hyperbolic equations with r2 = 0.9620 for HeLa cells and r2 = 0.9978 for SW1417 cells (both P < 0.001). (F) Inhibition of T22-GFP-H6 internalization in HeLa and SW1417 by increasing competitor/protein ratios of the natural CXCR4 ligand SDF1α.
Notes: GFP-H6 and human GLA were included as negative controls. Asterisks indicate significant differences when comparing with any of the negative controls (P < 0.001).
Abbreviations: GFP, green fluorescent protein; GLA, α-galactosidase.
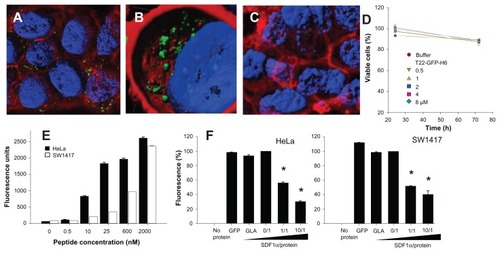
Figure 6 Characterization of T22-empowered nanoparticles. (A) Remaining fluorescence during incubation of T22-GFP-H6 in human serum. In the inset, integrity of T22-GFP-H6 monomers monitored by Western blot. (B) Internalization of T22-GFP-H6 in HeLa cells in the presence of 10% fetal calf serum, monitored by the number of fluorescent cells. (C) Dynamic light scattering size analysis of T22-GFP-H6 nanoparticles in NaCO3H buffer. (D) Transmission electron microscopy of T22-GFP-H6 nanoparticles.
Abbreviation: GFP, green fluorescent protein.
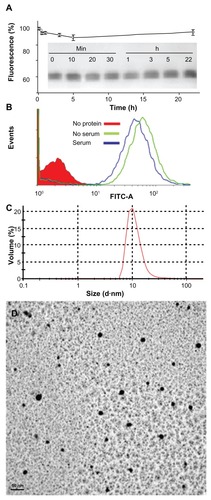
Figure 7 Stability of T22-GFP-H6 nanoparticles. (A) Size distribution of T22-GFP-H6 nanoparticles after one year of storage at −80°C. The same sample was further incubated at room temperature for 24 hours, submitted to one additional freezing and thawing step and analyzed. (B) These samples were tested for their ability to internalize SW1417, showing uptake images comparable with those shown in and .
Abbreviations: GFP, green fluorescent protein; RT, room temperature.
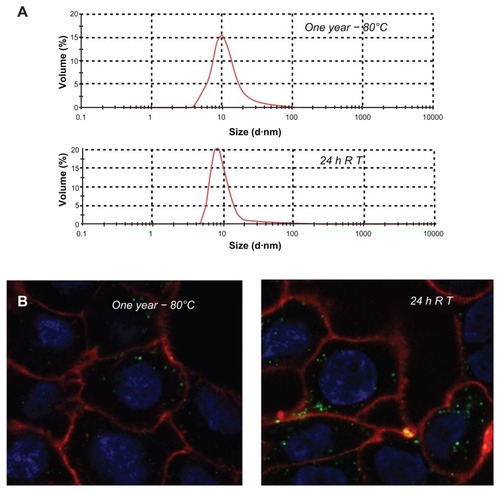
Figure 8 Molecular modeling of T22-GFP-H6 monomers and nanoparticles. (A) Electrostatic field of the T22-GFP-H6 building monomer (cationic in blue and anionic in red). (B) Potential organization of T22-GFP-H6 as pentamers of 11.1 nm (left) and as octamers of 13.3 nm (right), in which the intervention of T22 assists the electrostatic self-assembling of the multimeric protein complex.
Abbreviation: GFP, green fluorescent protein.
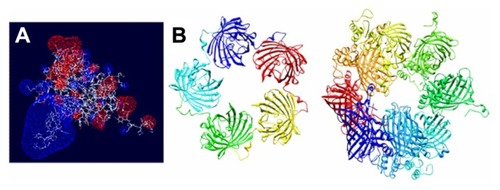
Figure 9 Biodistribution of T22-empowered nanoparticles in an animal model of colorectal cancer. (A) Nude mouse bearing a local tumor (black asterisk), mesenteric lymph node (black arrow), and peritoneal metastases (empty arrow) after microinjecting 2 × 10⁶ SW1417 human colorectal cancer cells into the cecal wall. The local tumor and mesenteric lymph node metastases overexpress CXCR4 in this model, as assessed by immunohistochemistry. (B) Selective biodistribution of T22-GFP-H6 in local tumor tissues 5, 24, or 48 hours after intravenous administration of 500 μg or 20 μg of nanoparticles as measured ex vivo. Fluorescence was undetectable in tumors from buffer-treated animals. (C) Accumulation of nanoparticles in peritoneal and lymph node metastases. No fluorescence was observed in any normal (liver, kidney, lung, heart) tissue, except for the biliary vesicle which showed fluorescence both in control and experimental animals.
Abbreviation: GFP, green fluorescent protein.
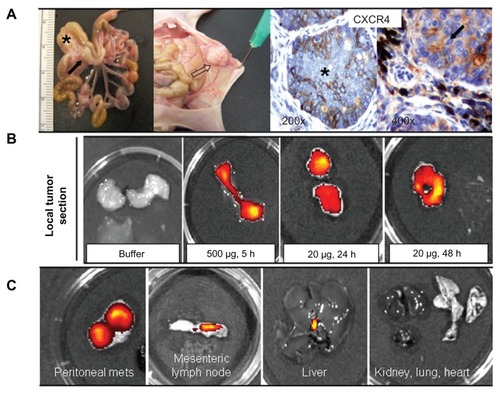
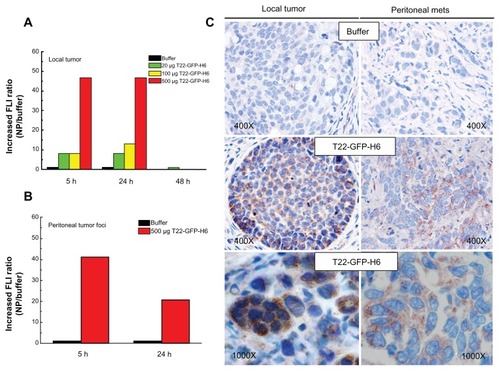
Figure 10 Accumulation of T22-empowered nanoparticles in colorectal cancer metastatic foci. Enhanced green fluorescence associated with nanoparticle accumulation in local tumors (A) and peritoneal metastases (B) in experimental mice, as compared with buffer-treated controls. (C) Anti-His tag inmunostaining showing cytosolic localization of T22-GFP-H6 in local tumor tissue and peritoneal metastases in mice injected with T22-NP, which was absent in control animals injected with buffer.
Abbreviations: FLI, increased fluorescence; GFP, green fluorescent protein.