Figures & data
Figure 1 Pattern diagram of GA/PLGA-CMB. The positively charged CMB is combined with the negatively charged GA/PLGA to form a GA/PLGA-CMB microbubble complex.
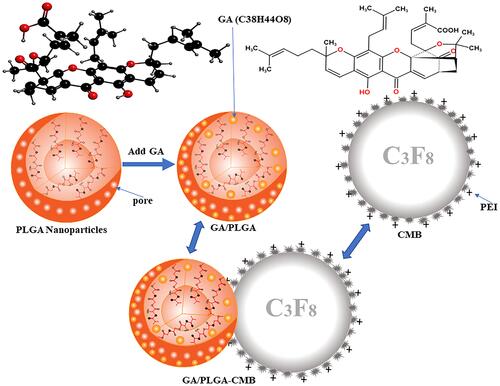
Figure 2 Ultrasound controlled drug release in vitro. (A) When the ultrasonic intensity is 0.63–0.88Mpa, GA/PLGA-CMBs can have “cavitation effect” (**p<0.01, ***p<0.001 versus control group, ##p<0.01 versus each other group). (B) The activity of U251 cells decreased significantly when the ultrasound intensity was 0.76–0.88 Mpa (**p<0.01, ***p<0.001 versus“0”Mpa group). (C) After coincubation of U251 cells with 1.5 μmol/L GA for 24 h, The cell viability of U251 cells was 48.71 ±2.84% (*p<0.05 versus “0”µmol/L group). (D) Different treatment groups correspond to the NaF fluorescence signal values in the liquid under the Transwell chamber (***p<0.001, #p<0.05 versus each other group). (E) The BBB model in vitro was constructed by bEend3 cells. The Zo-1 antibody was labeled with green immunofluorescence. The nucleus was labeled with DAPI, and the white arrow was marked as the open part of tight junction. Ruler: Bar=50 µm.
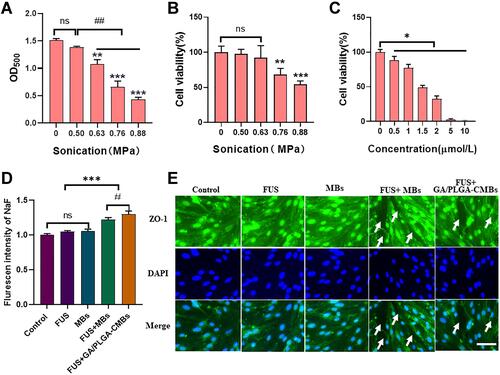
Figure 3 To evaluate the inhibitory effect of FUS combined with GA/PLGA-CMBs on U251 cells. (A) Different treatments of U251 cells correspond to the results of flow cytometry. (B) After 24 hours of different treatments, the viability of U251 cells in each group was detected by CCK-8. The cell viability of U251 cells in FUS+GA/PLGA-CMBs group was 0.81 ± 0.26% (***p<0.001 versus control group, #p<0.05 versus other groups). (C) After 24 hours of different treatments, the apoptosis rate of U251 in each group was detected by flow cytometry. The apoptosis rate of U251 cells in FUS+GA/PLGA-CMBs group was 76.73 ± 2.70% (***p<0.001 versus control group, ##p<0.01 versus each other group).
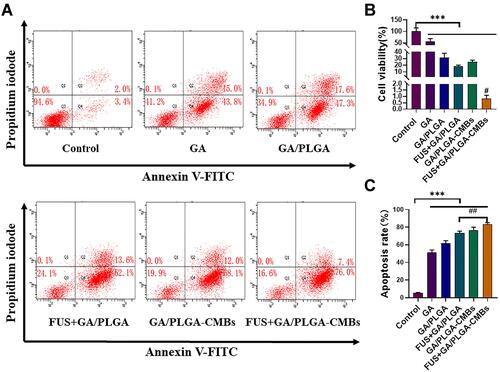
Figure 4 To evaluate the inhibitory effect of FUS combined with GA/PLGA-CMBs on U87 cells. (A) Different treatments of U87 cells correspond to the results of flow cytometry. (B) After 24 hours of different treatments, the viability of U87 cells in each group was detected by CCK-8. The cell viability of U87 cells in FUS+GA/PLGA-CMBs group was 49.34±1.95% (**p<0.01 versus control group, ###p<0.001 versus each other group). (C) After 24 hours of different treatments, the apoptosis rate of U251 in each group was detected by flow cytometry. The apoptosis rate of U87 cells in FUS+GA/PLGA-CMBs group was 27.68±0.89% (**p<0.01 versus control group, ###p<0.001 versus each other group).
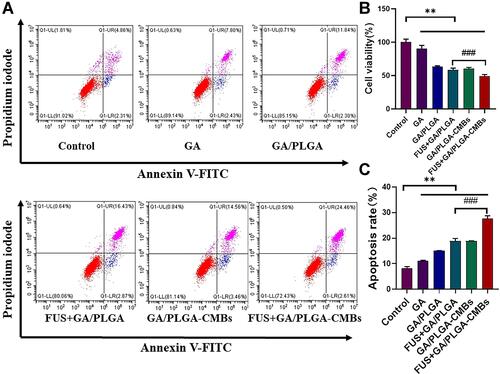
Figure 5 Characterizations of GA/PLGA-CMBs. (A) GA/PLGA was spherical and uniformly dispersed under scanning electron microscope (SEM). (B) GA/PLGA was spherical and wrinkled under transmission electron microscope (TEM). (C) CMBs showed spherical and hollow structure under TEM. (D) GA/PLGA-CMBs is composed of CMBs and GA/PLGA under transmission electron microscope. (E and F) Every 50 mg PLGA, 4 mg GA is added to prepare GA/PLGA. The entrapment efficiency of GA/PLGA was 83.04% ± 7.51% (*p<0.05 versus each other group). The drug loading of GA/PLGA was 6.64 ± 0.60% (*P <0.05 versus other three groups). (G and H) The particle size distribution of GA/PLGA-CMBs is 951.37 ± 110.32 nm.The potential distribution of GA/PLGA-CMBs was 5.30 ± 0.49 mV.
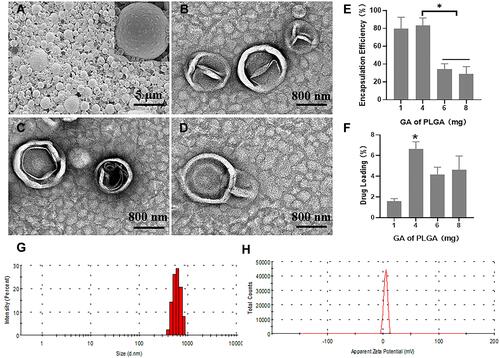
Figure 6 The stability of the GA/PLGA-CMBs under physiological condition. (A–C) each mouse was injected with 100 μL GA/PLGA-CMBs suspension via tail vein. In B mode and enhanced contrast mode, liver imaging was detected before and after injection of suspension. The in vivo imaging duration of GA/PLGA-CMBs was 30 min. n=3.
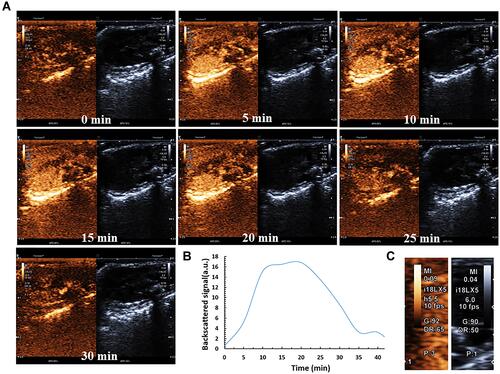
Figure 7 FUS+GA/PLGA-CMBs treatment inhibits the growth of U87 glioma cells. (A–C) Apoptosis was also evaluated by YF488-Annexin V/PI apoptosis detection kit, after the U87 cells of different treatment were incubated for 24 h. Values were presented as mean ± SD, n= 5.*** P <0.001, between groups. Compared with the Control group, Values were presented as mean ± SD, n= 5. # P <0.05. ### P <0.001.
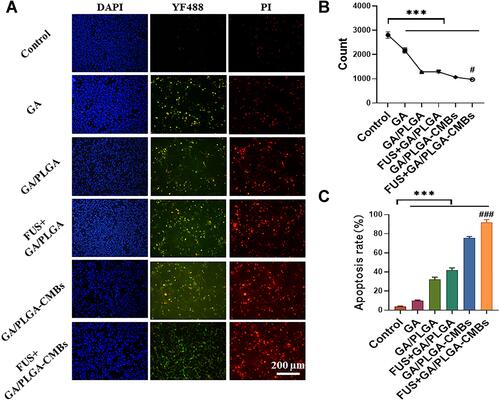
Figure 8 The blood-brain barrier (BBB) was opened by FUS combined with GA/PLGA-CMBs. 100 µL GA/PLGA or GA/PLGA-CMBs suspension was injected into the tail vein of mice. After 1min, the FUS with sound pressure intensity of 0.50,0.63,0.76,0.88 or 1.01Mpa worked for 30 seconds. When the ultrasonic intensity is 0.63–1.01 Mpa, FUS combined with GA/PLGA-CMBs can open BBB. FUS alone or FUS combined with GA/PLGA cannot open BBB. n=3.
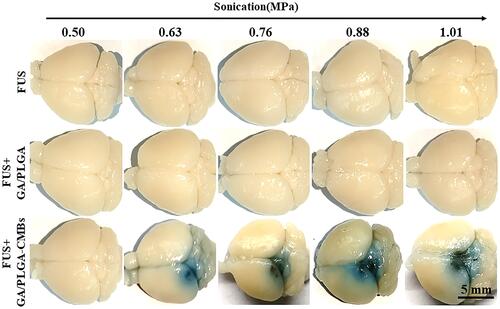
Figure 9 It is the most suitable and safe to open the ultrasonic parameters of BBB. (A) After the treatment of FUS with different sound pressure intensity combined with GA/PLGA-CMBs, the corresponding brain tissue was embedded in paraffin, stained with H&E, labeled with nucleus by DAPI and labeled with apoptotic cells by TUNEL. (B) When the ultrasonic intensity is 0.69–0.88Mpa, the erythrocyte extravasation is obvious (*p<0.05, **p<0.01, ***p<0.001 versus control group). (C) The apoptosis rate of TUNEL labeled apoptotic cells was counted by ImageJ software. The apoptosis rate is proportional to the sound pressure intensity (*p<0.05, **p<0.01, ***p<0.001 versus control group).
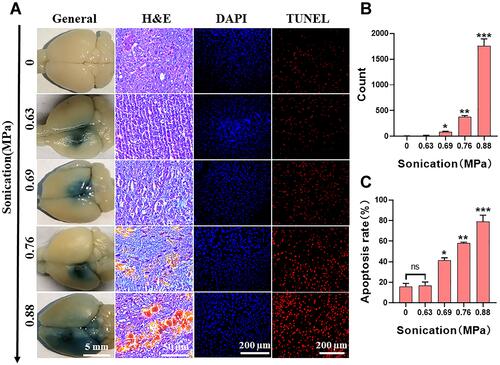
Figure 10 The anti-tumor effect was evaluated by in vivo imaging system (IVIS). (A and B) U87 cells carrying GFP-Luc-Puro gene fragments were selected for modeling. The glioma model mice were treated on the 10th day, once/2 days, for 3 times. The mice in each group were detected by IVIS on the 10th day, 17th day and 24th day, respectively. (C) The fluorescence signal values of mice in different treatment groups. The corresponding fluorescence signal curves of FUS+GA/PLGA-CMBs group and FUS+GA/PLGA group were lower.
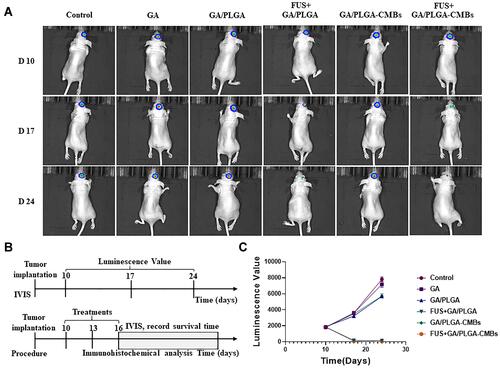
Figure 11 The anti-tumor effect was evaluated by immunohistochemistry. (A–D) On the 17th day of modeling, the brains of mice in different treatment groups were perfused and the corresponding tumor tissues were sectioned in paraffin. Tumor proliferation was detected by PCNA antibody and Ki-67 antibody, and tumor apoptosis was detected by TUNEL antibody (*p<0.05, **p<0.01, ***p<0.001 versus control group, ###p<0.001 versus each other group).
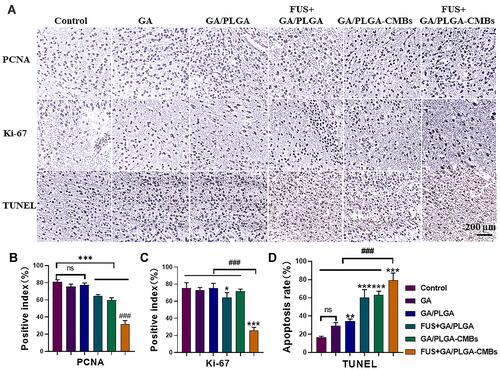
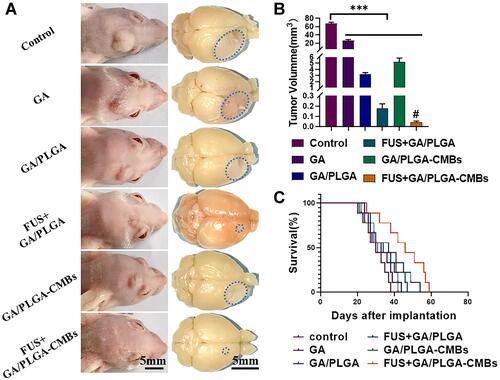
Figure 12 The anti-tumor effect was evaluated by general index. (A) After 37 days of modeling, the mice in different treatment groups corresponded to the gross view of glioma. (B) Quantification of tumor volume in mice with different treatment groups (***p<0.001 versus control group, #p<0.05 versus each other group). (C) The survival rate of six groups of mice was counted. The life cycle of mice in FUS+GA/PLGA-CMBs group was the longest, which was 59 days.