Figures & data
Figure 1 Micronized sacchachitin suspension (200 μg/mL) and scanning electron microscopy photographs for fibrous (A) and micronized sacchachitin (B).
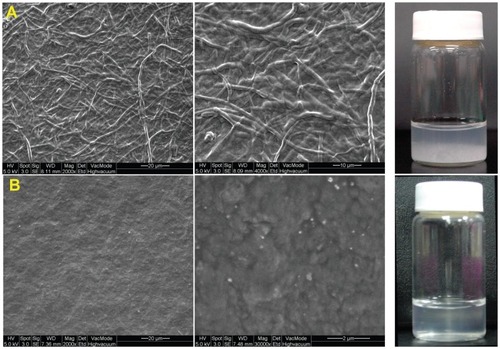
Figure 2 Rheological characteristics of aqueous solution of mSC nanogel (3% w/v) at 25 °C. (A) Viscosities as a function of shear rate; (B) Dynamic stress sweep study; (C) Frequency sweep curves; (D) Dynamic temperature ramp curves.
Abbreviations: mSC, micronized sacchachitin; SD, standard deviation.
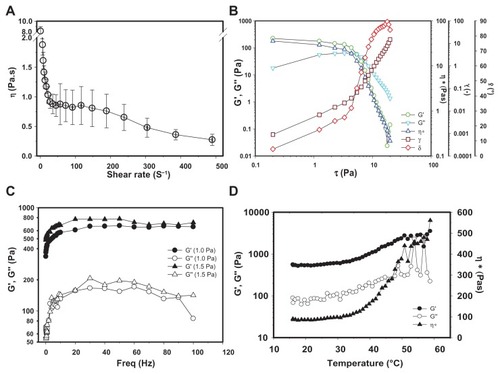
Figure 3 Results of the MTT cell proliferation assay (mean ± SD).
Note: Statens Seruminstitut rabbit cornea (SIRC) cells were treated with various concentrations of mSC for 24 and 48 h.
Abbreviations: mSC, micronized sacchachitin; MTT, 3-(4,5-Dimethylthiazol-2-yl)-2,5-diphenyltetrazolium bromid; SD, standard deviation.
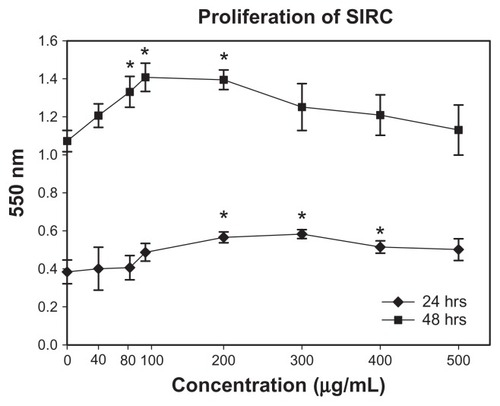
Figure 4 Representative phase contrast images of the migration assay to assess the effects of mSC suspension (200 μg/mL) in the media on wound closure. The images represent time-lapse images at time 0 (A) and 24 h later (B).
Abbreviation: mSC, micronized sacchachitin.
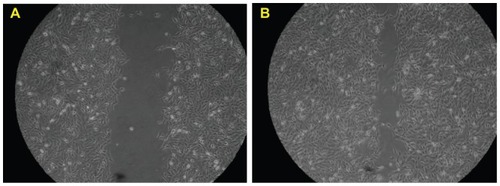
Figure 5 Fluorescein staining micrograph of a representative corneal wound obtained at 0, 24, 48, 72, and 96 h after wounding. The left column (A–E) represents corneas treated with mSC suspension (200 μg/mL), and the right column (F–J) represents corneas treated with phosphate-buffered saline.
Abbreviation: mSC, micronized sacchachitin.
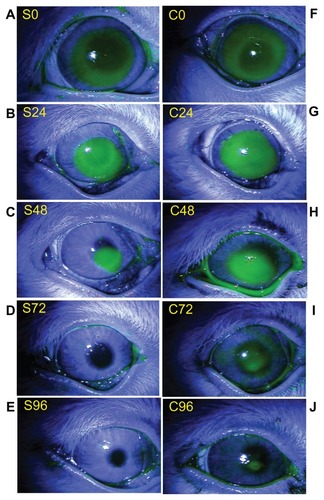
Figure 6 Percentage of rabbit corneal epithelial wound area in response to mSC treatment (Experimental group) compared to treatment with phosphate-buffered saline alone (Control group).
Note: *A paired t-test of significant difference with P < 0.05.
Abbreviation: mSC, micronized sacchachitin.
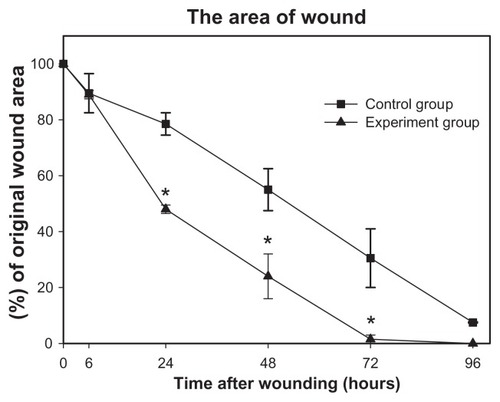
Figure 7 Histological examination of wounded rabbit corneas. (A) Normal cornea (B) mSC-treated group (C) Control group.
Abbreviation: mSC, micronized sacchachitin.
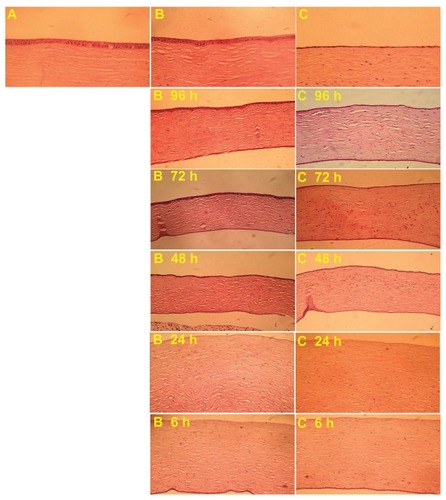
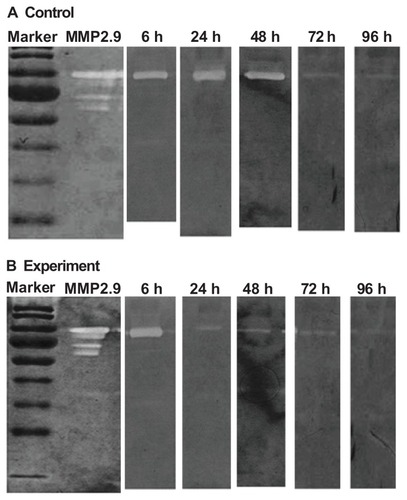
Figure 8 Variation in matrix metalloproteinase-9 (MMP-9) expression of the rabbit cornea at 6, 24, 48, 72, and 96 hours (h) during wound healing. SDS polyacrylamide gel electrophoretic analysis of tear samples from repairing cornea. Exp represents the experimental group (200 μg/mL mSC). Con represents the control group (phosphate-buffered saline). (A) MMP-9 expression of the experimental group (B) MMP-9 expression of the control group.