Figures & data
Table 1 Independent and Dependent Variables for Preparing BD/SA Cubosomal Dispersion
Table 2 Different Compositions of 0.064% BD 2% SA Loaded Cubosomes Dispersed Phase
Table 3 Particle Size, PDI, Zeta Potential, BD/SA Content for the 13 Different Cubosomal Dispersions and OF
Figure 1 (A) 3D representation of the effect of different GMO/P407/SCMC concentrations on cubosomes average particle size. (B) Two components mix of the effect of different GMO/P407 concentrations on cubosomes average particle size.
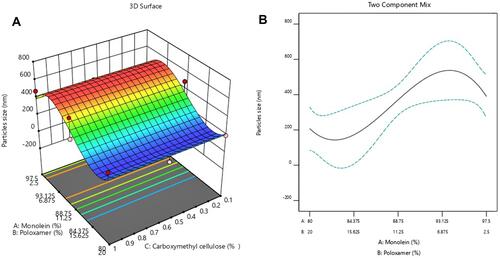
Figure 2 3D representation of the effect of different GMO/P407/SCMC concentrations on single-point viscosity.
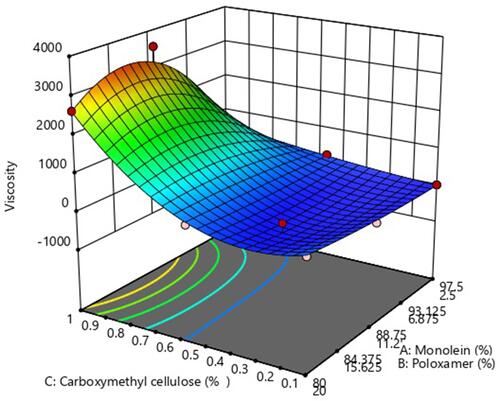
Table 4 Rheological Behaviour for the 13 Different Cubosomal Dispersions and OF
Figure 3 Micrographs by HRTEM shows cubic shaped nanoparticles with edged dimensions with different particle size within the nano-range.
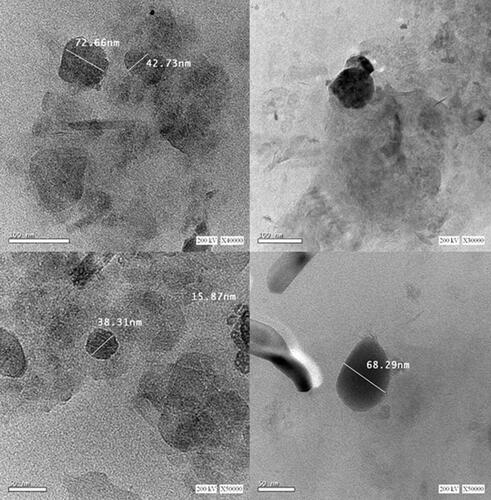
Figure 4 In-vitro release of BD/SA from the OF.
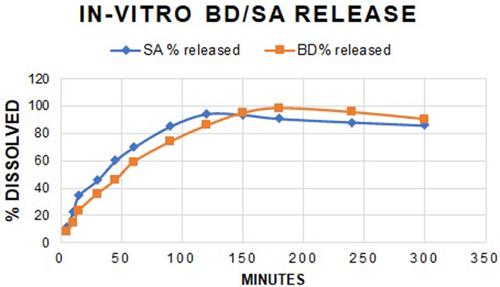
Figure 5 (A) The change in ear thickness over the 7 days of the experimental model. (B) The change in ear thickness in all groups on day 7.
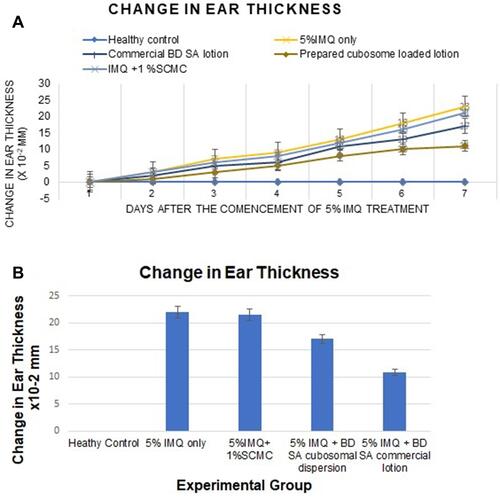
Figure 6 Changes in the right ear pinna receiving IMQ on days (A) 1, (B) 3 and (C) 7.
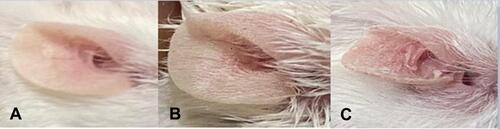
Figure 7 Psoriasis progression in all groups on days 2, 5 and 7.
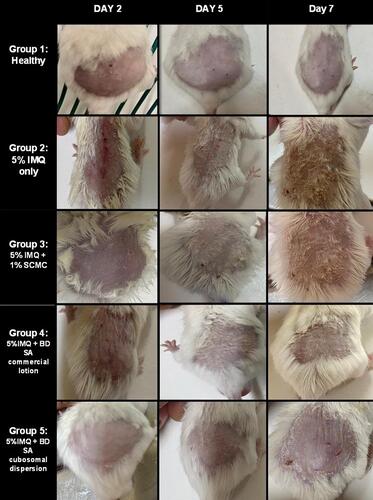
Figure 8 Graphical representation of the progression of (A) erythema, (B) thickness, (C) scaling, (D) cumulative PASI score in all groups over the 7 days of the experimental model.
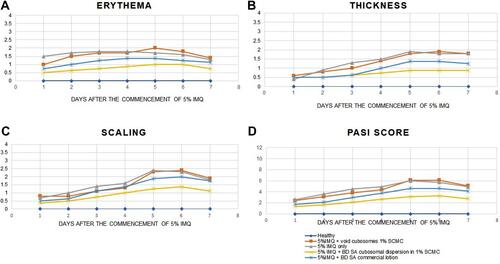
Figure 9 Representative photograph of harvested spleen in all groups on the 7th day of the experimental model. (A) Healthy group, (B) group receiving 5% IMQ only, (C) group receiving 5% IMQ + void cubosomes in 1%SCMC, (D) group receiving 5% IMQ + BD SA cubosomes in 1%SCMC and (E) group receiving 5% IMQ + commercial BD SA lotion.
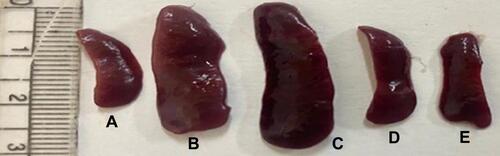
Figure 10 Spleen to body weight ratio among all groups on the 7th day of the experimental model.
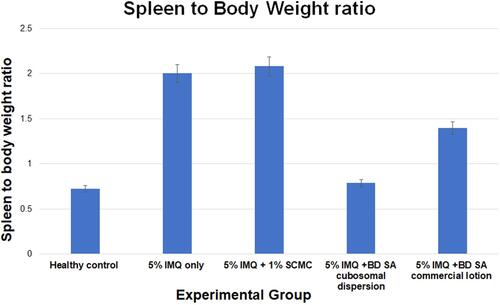
Figure 11 (A) Dorsal skin micrograph of healthy mice under X500um magnification, (B) dorsal skin micrograph of healthy mice under X50um magnification, (C) dorsal skin micrograph of mice receiving 5%IMQ only under X500um magnification, (D) dorsal skin micrograph of mice receiving 5%IMQ only under X50um magnification, (E) dorsal skin micrograph of mice receiving 5%IMQ and void cubosomes in 1%SCMC under X500um magnification, (F) dorsal skin micrograph of mice receiving 5%IMQ and void cubosomes in 1%SCMC under X50um magnification, (G) dorsal skin micrograph of mice receiving 5%IMQ and commercial BDSA lotion under X500um magnification, (H) dorsal skin micrograph of mice receiving 5%IMQ and commercial BDSA lotion under X50um magnification, (I) dorsal skin micrograph of mice receiving 5%IMQ and tested cubosomal BDSA dispersion in 1%SCMC under X500um magnification, (J) dorsal skin micrograph of mice receiving 5%IMQ and tested cubosomal BDSA dispersion in 1%SCMC under X50um magnification.
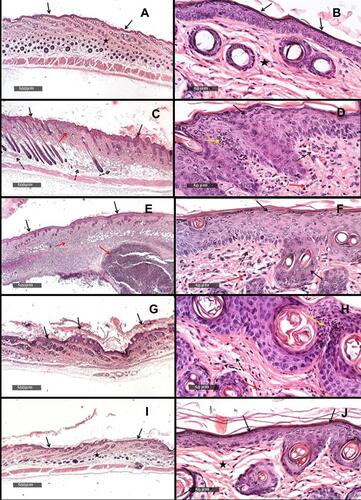
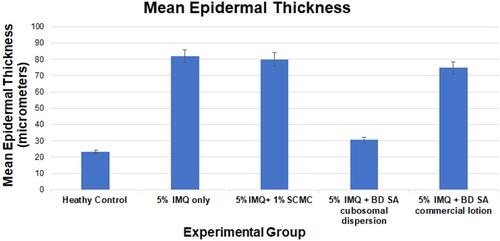
Figure 12 Average epidermal thickness in all groups at the 7th day of the experiment.