Figures & data


Table 1 Design Matrix Depicting the Experimental Runs and Values of Response Variables Obtained for Prepared Metformin HCL Bilosomes
Table 2 Analysis of Variance and Fit Statistics of the Factorial Model
Table 3 Box-Cox Confidence Intervals of Different Responses
Figure 1 3D response surface plots showing the influence of surfactant type, bile salt type and bile salt amount of metformin hydrochloride bilosomes on different responses of EE: entrapment efficiency (A); VS: vesicle size (B); PDI: polydispersity index (C); ZP: zeta potential (D); R: drug release (E); Jss: flux of drug permeated (F).
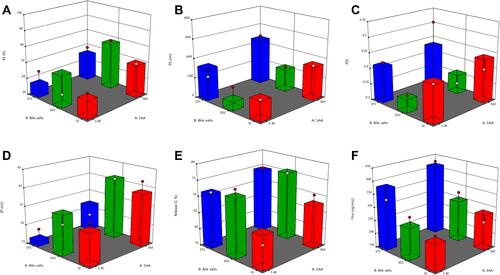
Figure 2 Box-Cox plot of all responses. EE: entrapment efficiency (A); VS: vesicle size (B); PDI: polydispersity index (C); ZP: zeta potential (D); R: drug release (E); Jss: flux of drug permeated (F).
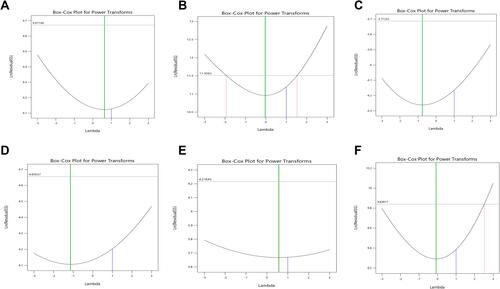
Figure 3 Release profile of metformin HCL from different bilosome formulations within 24 h.
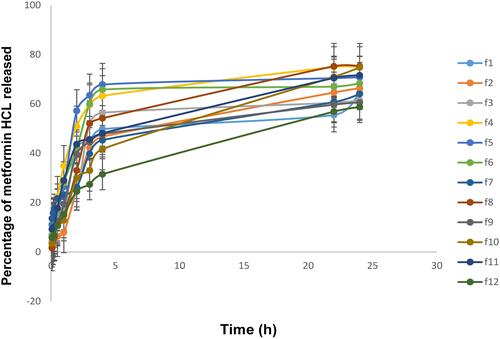
Table 4 In vitro Skin Permeation Parameters of Different Bilosome Formulations
Figure 4 Bar representation of formulating and response factors desirability of the optimized metformin HCL bilosome formulation (F8).
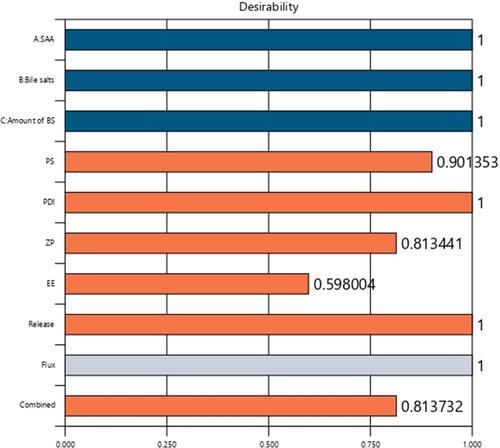
Table 5 Composition, Responses and Desirability of F8 and the Predicted Optimized Formulation
Figure 5 Continued.
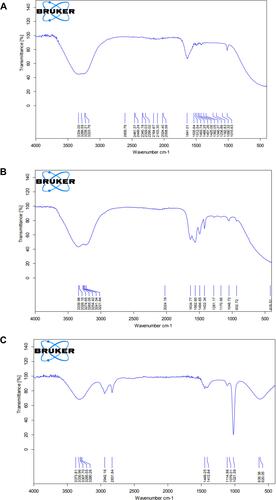
Figure 5 FTIR spectra of the optimized bilosome formulation (A), metformin HCL (B), Span 60 (C), sodium deoxycholate (D), and cholesterol (E).
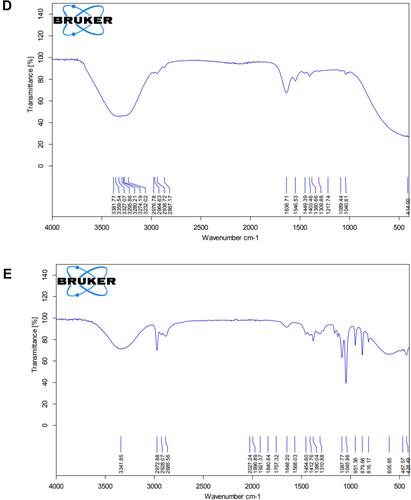
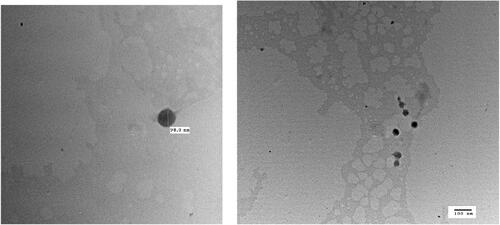
Figure 6 Transmission electron micrograph (TEM) of the optimized metformin HCL bilosome formulation (F8).