Figures & data
Table 1 Physico-Chemical Characterization of ND Formulations
Figure 1 In vitro oxygen release kinetics from cOLNDs and oxygen-saturated solution (OSS). The LW or MW cOLND capability to release oxygen in a hypoxic receiving phase was evaluated through an oximeter. Results are shown as mean ± SD from three independent experiments.
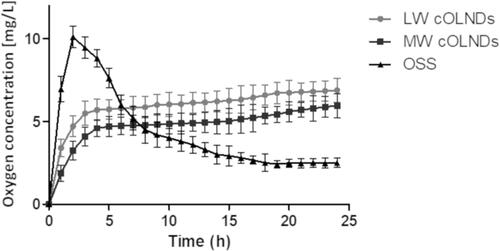
Figure 2 cND cytotoxicity and effects on human keratinocyte viability, under normoxic and hypoxic conditions. HaCaT cells (3x 10⁵ cells/mL for LDH studies and 1.6×10⁵ cells/mL for MTT studies) were left untreated or treated with MW or LW cOLNDs and cOFNDs for 24 h in normoxia (20% O2, black columns) or hypoxia (1% O2, white columns). After collection of cell supernatants and lysates, cytotoxicity percentage was measured through LDH assay (A) and cell viability percentage was measured through MTT assay (B). Results are shown as means ± SEM from three independent experiments. Data were also evaluated for significance by ANOVA. Vs normoxic control cells: a p<0.001; vs hypoxic control cells: b p<0.05.
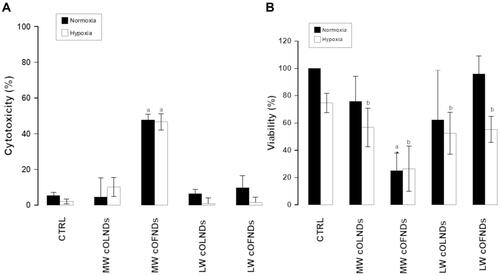
Figure 3 Confocal microscopy images of MW cND adhesion to MRSA bacterial wall and LW cND internalization by MRSA. MRSA (109 CFUs/mL) were left alone or incubated with 10% v/v FITC-labeled MW (A) or LW (B) cOLNDs or cOFNDs for 3 h. After staining bacteria with PI, confocal fluorescent images were taken using FITC and TRITC filters. Data are shown as representative images from three independent experiments. Red: PI. Green: FITC. Magnification: 100X.
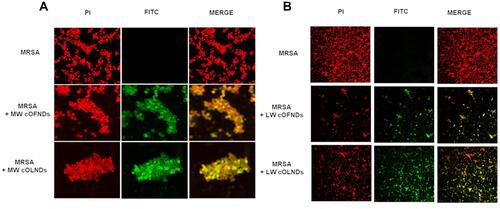
Figure 4 Anti-MRSA activity of cNDs and free chitosan. MRSA (104 CFUs/mL) were incubated alone or with OSS (10% v/v), free MW or LW chitosan (0.139% m/v) solution, MW or LW cOFND suspensions (10% v/v), and MW or LW cOLND suspensions (10% v/v) in sterile conditions at 37°C and their growth was monitored for 4, 6, and 24 h. At each incubation time, the samples were spread on TSA agar medium to determine the CFUs/mL. Results are shown as means ± SEM from three independent experiments and expressed as Log CFUs/mL. Data were evaluated for significance by ANOVA. Vs controls: a p<0.0001; vs MW cNDs: b p<0.001.
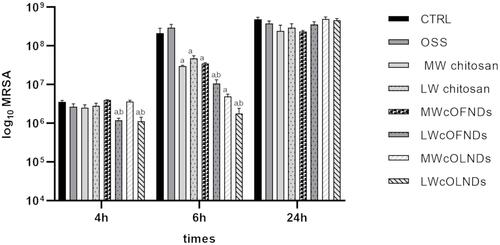
Figure 5 Confocal microscopy images of both MW and LW cND internalization by S. pyogenes. S. pyogenes (109 CFUs/mL) were left alone or incubated with 10% v/v FITC-labeled MW (A) or LW (B) cOFNDs or cOLNDs for 3 h. After staining bacteria with PI, confocal fluorescent images were taken using FITC and TRITC filters. Data are shown as representative images from three independent experiments. Red: PI. Green: FITC. Magnification: 100X.
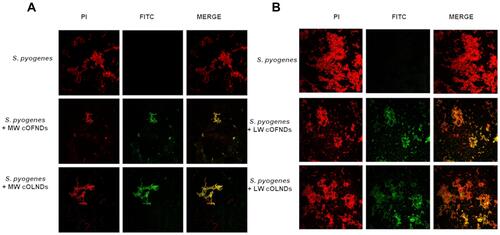
Figure 6 Anti-S. pyogenes activity of cNDs and free chitosan on S. pyogenes. S. pyogenes (104 CFUs/mL) were incubated alone or with OSS (10% v/v), free MW or LW chitosan (0.139% m/v) solution, MW or LW cOFND suspensions (10% v/v), and MW or LW cOLND suspensions (10% v/v) in sterile conditions at 37°C and their growth was monitored for 4, 6, and 24 h. At each incubation time, the samples were spread on TSA agar medium to determine the CFUs/mL. Results are shown as means ± SEM from three independent experiments and expressed as Log CFUs/mL. Data were evaluated for significance by ANOVA. vs controls: a p<0.0001; b p<0.001.
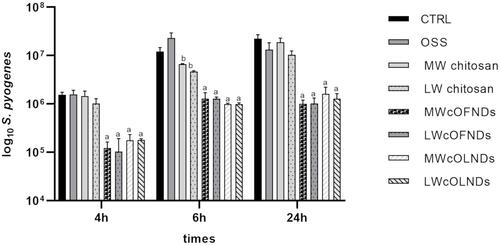
Figure 7 Confocal microscopy images of both MW and LW cND internalization by C. albicans. C. albicans (108 CFUs/mL) were left alone or incubated with 10% v/v FITC-labeled MW (A) or LW (B) cOFNDs or cOLNDs for 3 h. After staining yeasts with PI, confocal fluorescent images were taken using FITC and TRITC filters. Data are shown as representative images from three independent experiments. Red: PI. Green: FITC. Magnification: 100X.
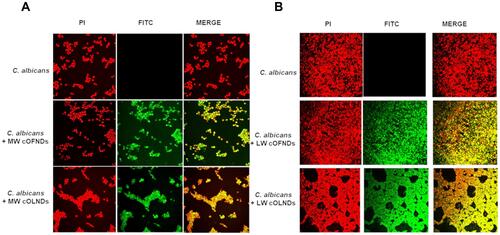
Figure 8 Confocal microscopy images of both MW and LW cND internalization by C. glabrata. C. glabrata (108 CFUs/mL) were left alone or incubated with 10% v/v FITC-labeled MW (A) or LW (B) cOFNDs or cOLNDs for 3 h. After staining yeasts with PI, confocal fluorescent images were taken using FITC and TRITC filters. Data are shown as representative images from three independent experiments. Red: PI. Green: FITC. Magnification: 100X.
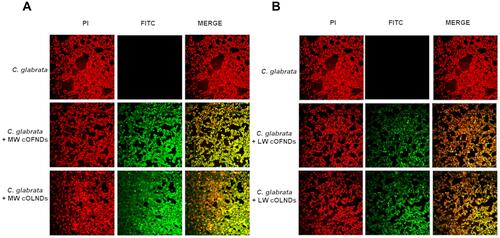
Figure 9 Anti-C. albicans activity of cNDs and free chitosan. C. albicans (105 CFUs/mL) were incubated alone or with OSS (10% v/v), free MW or LW chitosan (0.139% m/v) solution, MW or LW cOFND suspensions (10% v/v), and MW or LW cOLND suspensions (10% v/v) in sterile conditions at 37°C and their growth was monitored for 4, 6, and 24 h. At each incubation time, the samples were spread on SAB agar medium to determine the CFUs/mL. Results are shown as means ± SEM from three independent experiments and expressed as Log CFUs/mL. Data were evaluated for significance by ANOVA. Vs controls: ap<0.0001; vs MW cNDs: bp<0.001; Vs controls: cp<0.05.
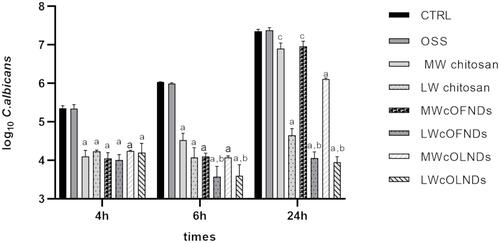
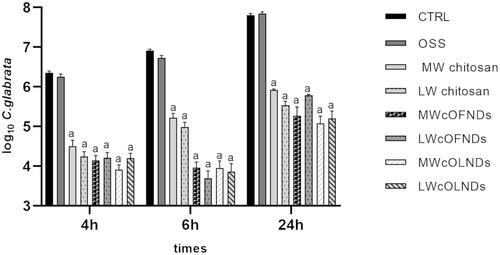
Figure 10 Anti-C. glabrata activity of cNDs and free chitosan. C. glabrata (105 CFUs/mL) were incubated alone or with OSS (10% v/v), free MW or LW chitosan (0.139% m/v) solution, MW or LW cOFND suspensions (10% v/v), and MW or LW cOLND suspensions (10% v/v) in sterile conditions at 37°C and their growth was monitored for 4, 6, and 24 h. At each incubation time, the samples were spread on SAB agar medium to determine the CFUs/mL. Results are shown as means ± SEM from three independent experiments and expressed as Log CFUs/mL. Data were evaluated for significance by ANOVA. Vs controls: ap<0.0001.