Figures & data
Table 1 The Experimental Range for Independent Variables and CQAs of CIN-PLGA-NPs
Table 2 Composition and the Observed Responses of the Design
Figure 1 Response 3D plots (A, B and C) and Contour plots (D, E and F) for the effect of PLGA amount (X1) and Poloxamer188 concentration (X2) on EE%, PS and ZP.
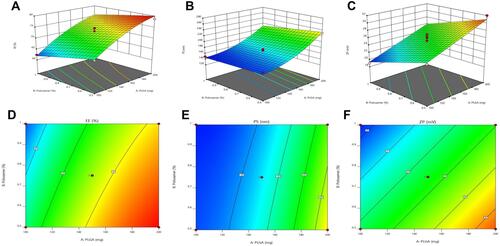
Figure 2 Transmission electron micrographs of CIN-PLGA-NPs with magnification of 20 kx (A and B), 15kx (C) and 8 kx (D).
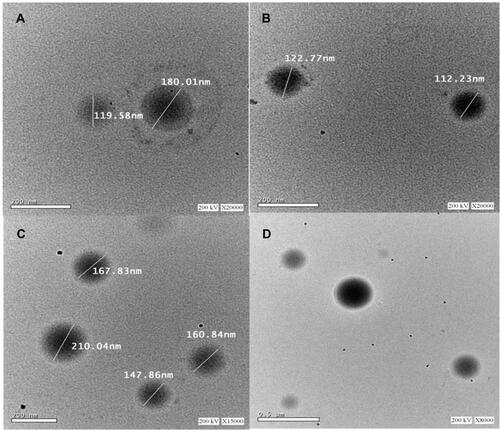
Figure 3 In-vitro dissolution profile of CIN-PLGA-NPs compared to CIN-Free.
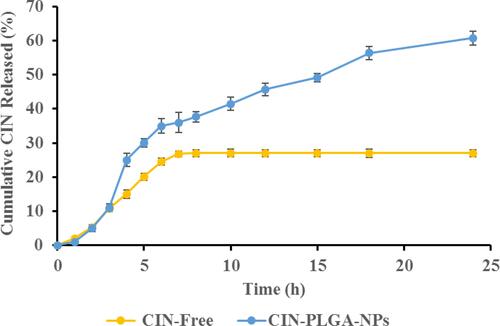
Figure 4 Effect of CIN-Free and CIN-PLGA-NPs on the viability of MDA-MB-231 breast cancer cell lines, as detected by MTT assay.
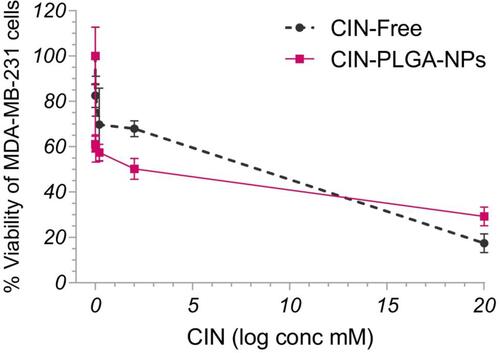
Figure 5 Effect of CIN-Free and CIN-PLGA-NPs on the migration of MDA-MB-231 cells using scratch wound assay. (A) Representative photomicrographs for the effect CIN-Free and CIN-PLGA-NPs on wound closure in MDA-MB-231 cells at 0, 24 and 48 hr. (B and C) Bar charts showing wound closure (%) in control untreated, CIN-Free-, and CIN-PLGA-NPs-treated cells. Values are presented as mean ± SD. One-way analysis of variance (one-way ANOVA) followed by Tukey’s post hoc test was applied for statistical analysis. Significant difference at **P < 0.01 and ***P < 0.001.
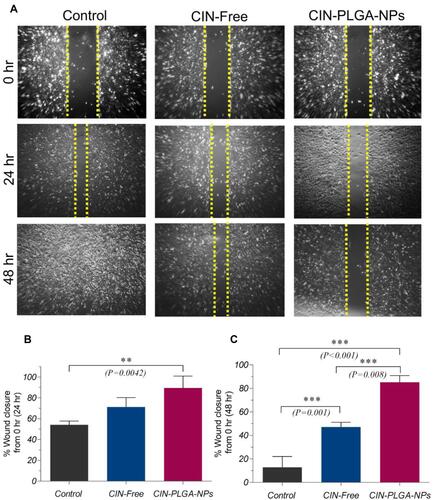
Figure 6 Bar charts showing tumor volumes (mm3) in control and treated groups at (A) 15, (B) 18, and (C) 21 days post treatment. (D) Tumor volume (mm3) in EAC-bearing mice of control and treated groups at different time points. (E) Body weight of animals in treated and control groups, at different time points. Values are presented as mean ± SE. One-way analysis of variance (one-way ANOVA) followed by Tukey’s post hoc test was applied for statistical analysis. Significant difference compared to control at *P < 0.05, **P < 0.01, ***P < 0.001.
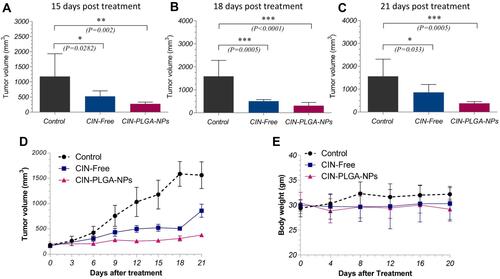
Figure 7 Photomicrographs of H&E-stained tumor sections (×100 and ×400) in control group (A and (B), CIN-Free (C and (D), and CIN-PLGA-NPs (E and (F). Black arrows indicate malignant cells; red arrows indicate apoptosis, and yellow arrows indicate necrotic areas.
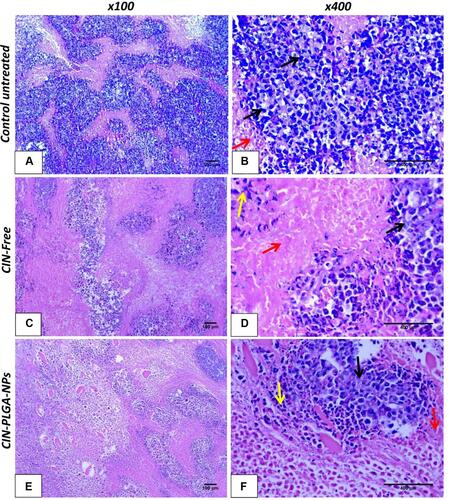
Figure 8 Anti-caspase-3 immunohistochemical staining (DAB, ×400) for (A) Control untreated, (B) CIN-free-treated, and (C) CIN-PLGA-NPs-treated groups. (D) Bar chart for the percentage of caspase-3 positive expression in tumor sections of different groups. Values are presented as mean ± SD. One-way analysis of variance (one-way ANOVA) followed by Tukey’s post hoc test was applied for statistical analysis. Significant difference compared to control at ***P < 0.001. Black arrows indicate positively stained cells observed as brown discoloration in the cytoplasm.
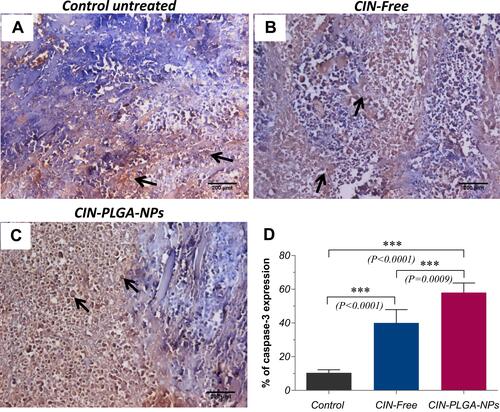
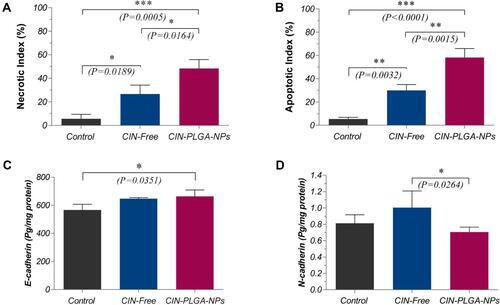
Figure 9 Semi-quantitative estimation of (A) Necrotic and (B) Apoptotic indices in H&E-stained tumor sections. Levels of (C) E-cadherin and (D) N-cadherin levels in tumor sections estimated by ELISA. Values are presented as mean ± SD. One-way analysis of variance (one-way ANOVA) followed by Tukey’s post hoc test was applied for statistical analysis. Significant difference compared to control at *P < 0.05, **P < 0.01, ***P < 0.001.