Figures & data
Scheme 1 Schematic illustration of hybrid membrane derived nanovaccine for enhancing cancer immunotherapy.
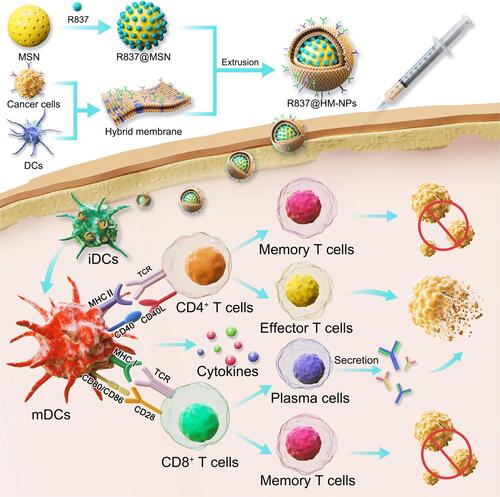
Table 1 Physicochemical Characterization of R837@HM-NPs
Figure 1 Physicochemical characterization of R837@HM-NPs. Size distributions (A–C) from dynamic light scattering analysis of MSN, R837@MSN and R837@HM-NPs. (D) Evidence for the coverage of hybrid membrane coated on the surface of MSN by confocal microscopy. (E) Size changes of R837@HM-NPs over seven successive days in PBS. (F) Zeta potential changes of R837@HM-NPs in seven successive days in PBS. (G) In vitro release profiles of R837 from R837@MSN and R837@HM-NPs in PBS (at pH 5.0 and pH 7.4). (H) Cell viability of BMDCs incubated with PBS, MSN and HM-NPs at different concentrations measured at 48 h.
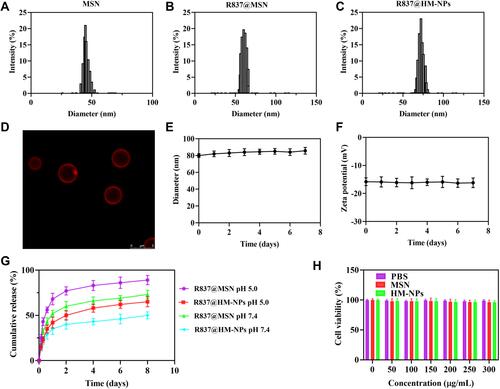
Figure 2 Cellular uptake and endocytic mechanism of HM-NPs in BMDCs. (A) CLSM images of BMDCs after 4 h incubation with calcein-loaded MSN and HM-NPs. (B) Cellular uptake of MSN and HM-NPs in BMDCs by flow cytometric analyses after 4 h of incubation. Control indicates the autofluorescence of untreated cells. (C) Cellular uptake efficiency of R837@HM-NPs in BMDCs in the presence of different endocytosis inhibitors.
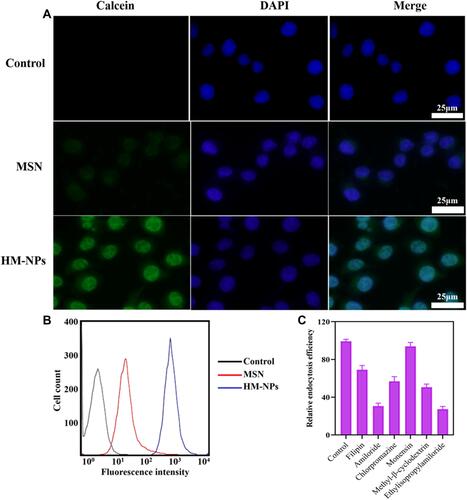
Figure 3 The immune stimulatory effect of R837@HM-NPs on BMDCs in vitro. (A) Representative flow cytometry data to show BMDCs maturation induced by different treatments in vitro. (B) Representative statistical data to show BMDCs maturation induced by different treatments in vitro. ELISA results of IL-6 (C), IL-12p40 (D), and TNF-α (E) secretion from BMDCs after R837@HM-NPs treatment. (F) Flow cytometric analyses of the expression of CD4 and CD8, the markers for T cell activation, after in vitro incubation of T cells with PBS, R837, R837@MSN, HM-NPs, and R837@HM-NPs for 24 h. *P < 0.05, **P < 0.01.
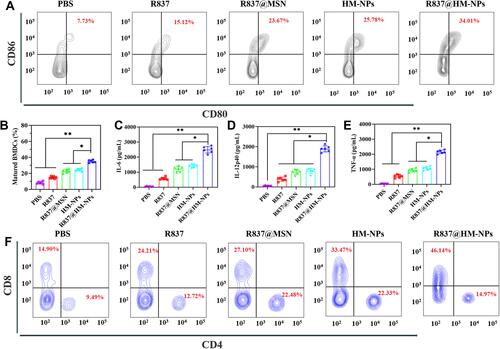
Figure 4 The preventive efficacy of R837@HM-NPs nanovaccine for tumor occurrence in vivo. (A) Schemes of tumor prevention experiment design. The average tumor growth curves (B) and individual tumor growth curves (C) for different groups of mice as indicated (n = 6). (D) Survival curves as a function of treatment type. (E) Cytokine concentrations including IL-6, IL-12p40 and TNF-α in serum from treated mice. (F) Representative flow cytometry data to show DCs maturation in lymph nodes induced by different treatments in vivo. (G) Flow cytometric analysis of CD4+ and CD8+ T cells in tumors, gated on CD3+ T cells. *P < 0.05, **P < 0.01.
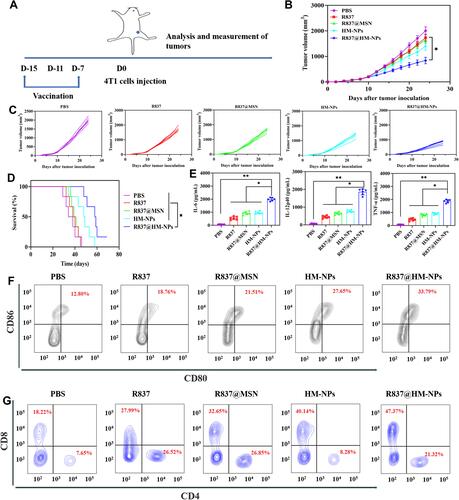
Figure 5 In vivo therapeutic effect of R837@HM-NPs nanovaccine in combination with αPD-1. (A) Schematic illustration of combining R837@HM-NPs-based vaccination with αPD-1 therapy to inhibit established 4T1 tumors. The average tumor growth curves (B) and individual tumor growth curves (E) for different groups of mice as indicated (n = 6). (C) Weights of tumors from 4T1-bearing mice receiving different treatments. (D) Body weight profiles of tumor-bearing mice during treatment. Representative H&E (F) and TUNEL (G) images of tumor tissues in different treatment groups at the end of the experiments. Cell nuclei were stained blue, and TUNEL was stained green. Scale bar, 100 μm (HE); 20 μm (TUNEL). (H) Representative immunofluorescence images of tumors showing CD8+ (green) and CD4+ (red) infiltration in the tumor tissues for all the treatment groups. Scale bar, 20 μm. *P < 0.05, **P < 0.01.
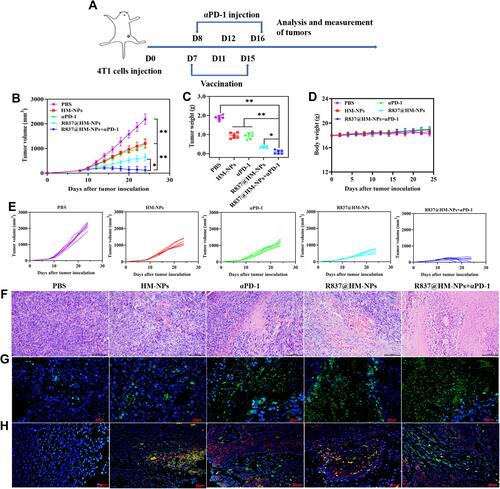
Figure 6 The immune activation mechanism of R837@HM-NPs in combination with αPD-1 on inhibition of 4T1 tumor growth. Representative flow cytometry data of tumor infiltrating CD4+CD8+T cells (A), CD4+Foxp3+T cells (C), CD80+CD11b+F4/80+ cells (E), and CD206+CD11b+F4/80+ cells (G) for different groups of mice after various treatments. Representative statistical data of tumor infiltrating CD4+CD8+T cells (B), CD4+Foxp3+T cells (D), CD80+CD11b+F4/80+ cells (F), and CD206+CD11b+F4/80+ cells (H) for different groups of mice after various treatments. (I) Flow cytometric analysis assessing the relative abundance of CD8+/Treg for different groups of mice after various treatments. Cytokine levels of IL-6 (J), IL-12p40 (K), and TNF-α (L) in serum from tumor-bearing mice isolated at 48 h after the last injection. (M) Heat map analysis of ex tumors after receiving different treatments as indicated through transcriptome sequencing (RNA-seq). (N) Gene ontology biological process analysis of ex tumors after receiving different treatments as indicated. *P < 0.05, **P < 0.01.
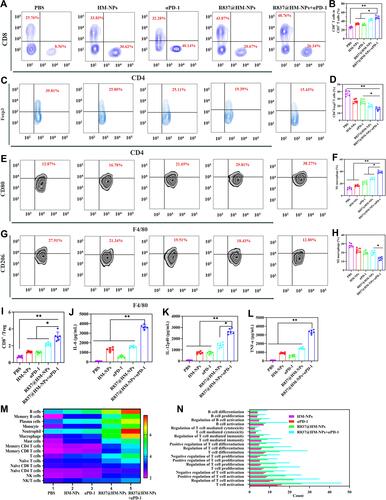
Figure 7 Biocompatibility analysis of R837@HM-NPs in combination with αPD-1. (A) Representative histological examinations of H&E staining organs from mice under different treatments. Scale bars, 100 µm. (B) Biosafety analysis in the aspect of blood routine, liver function and renal function (n = 6).
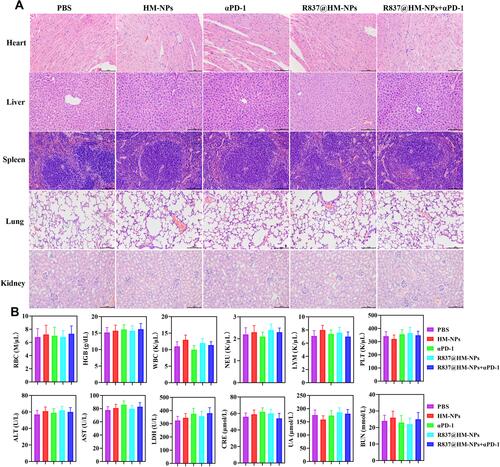
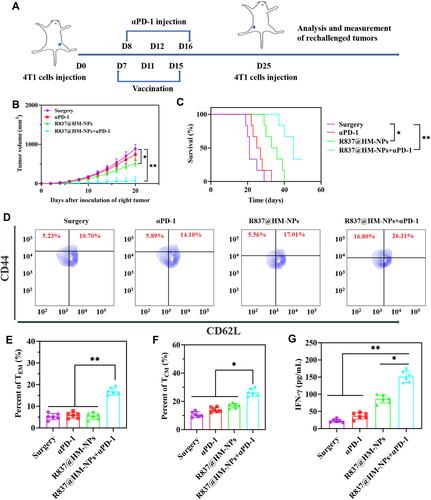
Figure 8 The long-term immunological memory effects of R837@HM-NPs nanovaccine in combination with αPD-1 therapy against the rechallenged 4T1 tumor model. (A) Schematic illustration of R837@HM-NPs nanovaccine in combination with αPD-1 therapy against the rechallenged 4T1 tumor model. (B) Tumor growth curves of the right tumor for different groups of mice (n = 6). (C) Survival curve of mice treated with various formulations after inoculation of the right tumor. Representative flow cytometry data (D) and statistical data (E and F) of TEM and TCM in the spleen analyzed by flow cytometry (gated on CD3+CD8+ T cells) on day 35. (G) Concentration of IFN-γ in serum from tumor-bearing mice isolated on day 35.*P < 0.05, **P < 0.01.