Figures & data
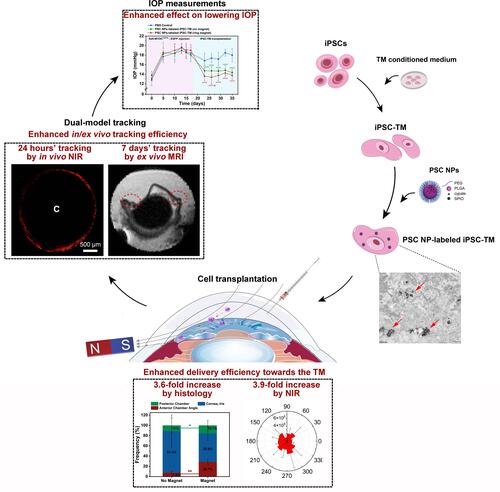
Table 1 Antibodies for IHC and WB
Figure 1 Schematic illustration of PLGA-SPIO-Cypate (PSC) NPs and the experimental design. (A). This design aims to position the injected cells (Purple) to the TM region through the magnetic field and track the transplanted cells by a NIR/MRI dual-model imaging. (B). Schematic diagram of timelines of NP synthesis, in vitro tests, and in vivo tracking.
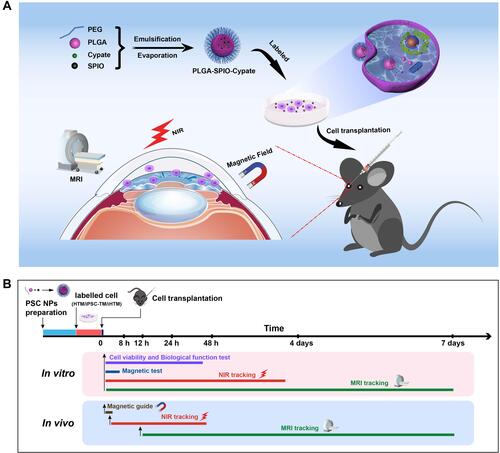
Figure 2 Characterizations of PSC NPs. (A–D). Transmission electron microscope (TEM) images of PLGA nanocarriers (A), SPIO (B), and PSC NPs (C–D) confirm that Fe3O4 nanoparticles, black spots, are embedded in the PLGA spherical shells. (E). The region in the red frame shows a magnified view of a single NP Size distribution of PSC NPs with an average diameter of 243.0 ± 1.3 nm. (F). Ultraviolet-Visible-NIR absorption spectra of the PLGA nanocarrier, Cypate, SPIO, PLGA-SPIO, PLGA-Cypate, and PLGA-SPIO-Cypate NPs. Like the absorption wavelength of Cypate and PLGA-Cypate, PSC NPs are determined with a peak wavelength of about 781 nm. Insert image shows different nanoparticles in water under ambient light (a: PLGA NPs, b: PLGA-SPIO NPs, c: PLGA-Cypate NPs, d: PLGA-SPIO-Cypate NPs). (G). Fluorescence spectra of PLGA, SPIO, cypate, PLGA-SPIO, PLGA-cypate, and PLGA-SPIO-Cypate NPs (excitation peak: 781nm; emission peak: 815 nm). (H). Magnetic hysteresis curves of PSC NPs and SPIO determined by vibrating sample magnetometer. Insert image shows the accumulation of PLGA-SPIO-Cypate NPs adjacent to the magnet.
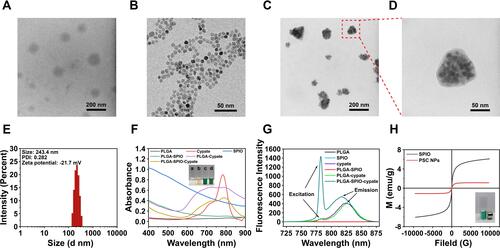
Figure 3 Endocytosis of PSC NPs by miPSC-TM. (A) Prussian blue staining of miPSC-TM cells. The cytoplasm of miPSC-TM is stained with Eosin (pink). Ferric ferricyanide formed after Prussian blue staining is shown in blue. (B) Biological transmission electron microscopy of PSC NP-labeled miPSC-TM cells. The region in the red frame is magnified in (C). In the high-magnification image, each arrow points at a single or cluster of PSC NPs.
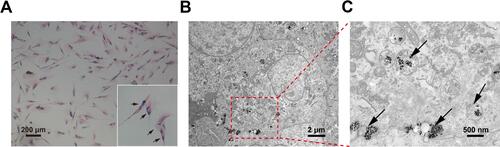
Figure 4 Good biocompatibility of PSC NPs. (A). CCK-8 assay of PSC NP (ranging from 12.5 to 150 μg/mL)-labeled iHTM, HTM, and miPSC-TM revealing a negligible effect of NPs on cell viability. (B). Images of red blood cells treated with PSC NPs at a series of concentrations (0, 12.5, 25, 50, 75, and 100 μg/mL). H2O and 1×PBS are used as positive and negative controls, respectively. PSC NPs at concentrations less than 75 μg/mL lead to a hemolysis rate of less than 5%, which is biocompatible and safe for practice.Citation60–Citation62 Data are expressed as the mean ± SD.
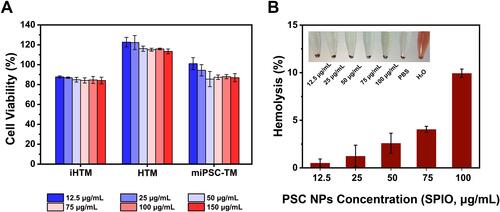
Figure 5 In vitro near-infrared imaging. (A). Quantification assay showing fluorescence intensities of PSC NP-labeled iHTM cells after labeling for different times. Signal peaks at 10 hours of incubation, which is the best for further in vivo tracking purposes. (B). Fluorescence signals in PSC NP-labeled iHTM cells diminish over time and vanish after 72 hours. 64 h vs 72 h: P < 0.05, 72 h vs 88 h: P > 0.05 by one-way ANOVA. (C). A confocal image of PSC NPs-labeled iHTM, HTM, and miPSC-TM. Nanoparticles accumulated in the cytoplasm are shown in red. Nuclei are labeled with DAPI (blue). (D). Upper panel: A representative image of the fluorescence intensities of iHTM pellets (500,000 cell number) labeled with PSC NPs at a series of concentrations (12.5, 25, 50, 75, 100 μg/mL). Unlabeled miPSC-TM is used as a control. Lower panel: The radiant efficiency of miPSC-TM labeled with PSC NPs is calculated with a significant increase as PSC NP concentration increased (12.5, 25, 50, 75, 100 μg/mL). *P < 0.05, **P < 0.01, ***P < 0.001, ****P < 0.0001 by one-way ANOVA. (E). Radiant efficiencies of iHTM, HTM, and miPSC-TM labeled with PSC NPs (35 μg/mL). Typical results from n=3 technical repeats are shown. **P < 0.01 by one-way ANOVA. Flow cytometric analysis of PSC NP-labeled miPSC-TM (F) and HTM (G). Compared to the fluorescence intensity of unlabeled cells, PSC NPs can be effectively endocytosed by 97.6% miPSC-TM and 99.1% HTM. Data are expressed as the mean ± SD.
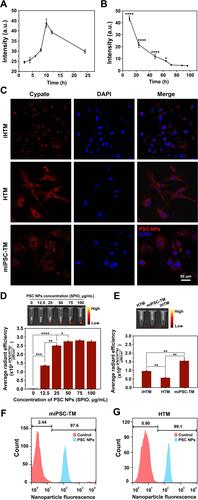
Figure 6 Movement of PSC NP-labeled miPSC-TM cells in the magnetic fields. (A). PSC NP-labeled miPSC-TM cells aggregate on the magnet side of a 15 mL tube. (B). Magnetic cell steering is quantified using a custom-made cell culture chamber loaded with floating miPSC-TM cells. (C). Schematic illustration of the experimental conditions, including control (no magnet) and in the presence of a magnet with 24 mT magnetic strength positioned on the lateral side of the chamber. (D). After 8 hours slides are analyzed using a light microscopy (Nikon) to quantify the adhering cells. The number of cells adhering to the lateral slide is significantly increased. N=3, *P < 0.05 by two-tailed t-test. (E). Schematic diagram of the apparatus that injects PSC NP-labeled miPSC-TM cells at an infusion rate of 0.8 mL/min. (F). Comparative images showing the trajectories of 9 million magnetically steered (left; 143 mT at a distance of 30 mm) versus free falling (right) PSC NP-labeled miPSC-TM cells. The magnetic force deflects the cells from a straight downward path experienced under gravitational force alone. (G). The confocal photographs of the trajectory of individual PSC NP-labeled miPSC-TM in a magnetic field (26 mT at a distance of 12 mm) at 0, 4, 8, 16 seconds. The motion of PSC NP-labeled miPSC-TM cells is recorded as the control. Compared to the Brownian motion of cells in control, the lateral magnet significantly attracts the cells. PSC NP-labeled miPSC-TM is shown in red fluorescence. N=3. (H). After subtracting the cell moving distance in control, the speed of single-cell movement in the magnetic field is calculated using the moving distance of ten PSC NP-labeled miPSC-TM cells after 16 seconds of exposure. Typical results from n=3 technical repeats are shown. **P < 0.01 by two-tailed t-test. Data are expressed as the mean ± SD.
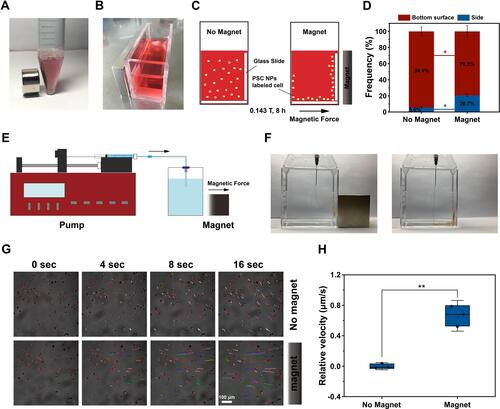
Figure 7 In vitro tracking by MRI. (A). The codependent relationship of R2 signal and the concentration of PSC NPs. (B). T2-weighted scans show iron-mediated darkening correlated to the increased PSC NP concentration. Upper panel: PSC NPs as the sample; Lower panel: PSC NP-labeled iHTM cells as the sample. (C). Relationship of R2 signal and PSC NP (12.5, 25, 50, 75, 100 μg/mL)-labeled iHTM. (D). Change of R2 signals in PSC NP-labeled iHTM cells over time. Upper panel: T2-weighted scans; Lower panel: Quantification of R2 signals. *P < 0.05, **P < 0.01 by one-way ANOVA. (E). Change of R2 signals in iHTM cells at different cell concentrations (F). R2 signals in PSC NP-labeled iHTM, HTM and miPSC-TM cells. Typical results from n = 3 technical repeats are shown. Data are expressed as the mean ± SD.
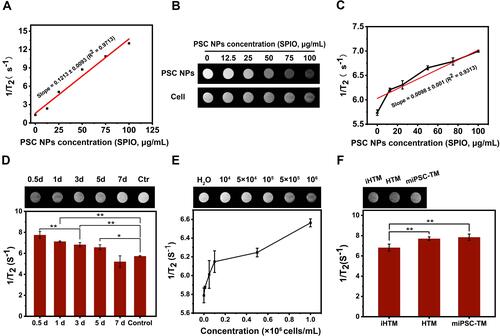
Figure 8 Cell fate of iHTM, HTM, and miPSC-TM after PSC NP-labeling. (A). Immunohistochemical staining of MMP3, TIMP3, and MYOC (all in red) in label-free or PSC NP-labeled iHTM, HTM, and miPSC-TM. Nuclei are labeled with DAPI (blue). (B). Upper panel: Western blot analysis of MYOC (top) or GAPDH (bottom) in normal or PSC NP-labeled iHTM, HTM, and miPSC-TM. Lower panel: Quantification of band intensities using Image Lab software (Bio-Rad). Controls of iHTM, HTM, and miPSC-TM are normalized to be 1. *P < 0.05. **P < 0.01 by two-tailed t-test. (C) Fluorescence intensity of MYOC from IHC images. ****P < 0.0001 by two-tailed t-test. (D). Representative IHC staining of F-actin (green) and nuclei (blue) shows the CLANs with hubs and spokes, pointed by the white arrows. (E). The role of PSC NP-labeled miPSC-TM in stimulating mTM cell division. Representative images of mTM pre-labeled with CellTracker Red CMTPX of control and co-cultured groups (48 hours). (F). Quantification of mTM cellularity in above conditions. Normal or PSC NP-labeled miPSC-TM cells significantly stimulate mTM division after 48 hours in co-culture. **P < 0.01. ***P < 0.001 by one-way ANOVA analysis. Typical results from n=3 technical repeats are shown. Data are expressed as the mean ± SD.
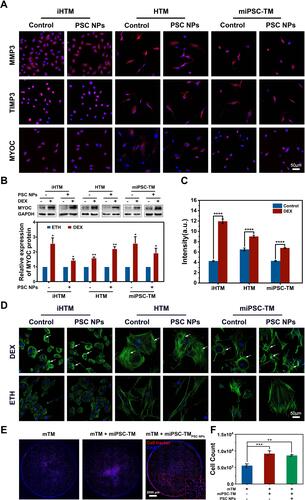
Figure 9 Delivery of PSC NP-labeled miPSC-TM towards the TM in living mice using either lateral or ring magnets. (A–D). Representative en face micrographs of the TM region in living mice under four conditions: no magnet without injections; no magnet with PSC NP-labeled miPSC-TM injection; a lateral magnet with PSC NP-labeled miPSC-TM injection; a ring magnet with PSC NP-labeled miPSC-TM injection. Magnets are placed adjacent to the limbus and the TM. Red represents the PSC NP-labeled miPSC-TM cells. “C” denotes the approximate center of the cornea. (E–H). The polar histograms show the total fluorescence intensity in the TM region for 30° sectors. Note that the lateral magnet leading to a non-uniform distribution of PSC NP-labeld miPSC-TM with an obvious cell aggregation adjacent to the lateral magnet (panel (G). (I). Quantification assay of the averaged fluorescence intensity in the TM region from three eyes. Data shown represent means ± SD.
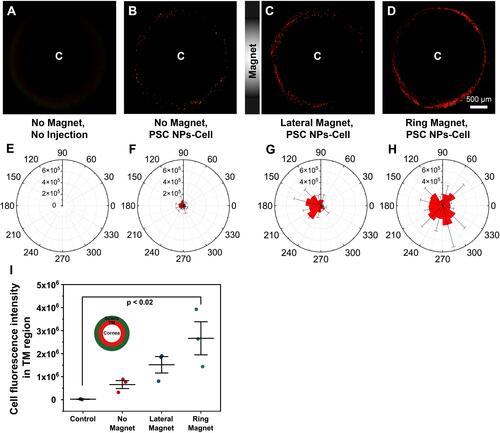
Figure 10 Optimized magnetic field strength and exposure time. (A–F). Representative en face micrographs of the TM regions in eyes exposed to two ring magnets (30 and 60 mT) for different durations (15 and 45 mins) followed by the transplantation of 0, 12, 24, 48 hours. (G–L). Polar histogram of the total fluorescence intensity in the TM region for 30° sectors. (M). Quantification of the fluorescent signal in the TM region exposed to two different field strengths (30 and 60 mT) for two different times (15 and 45 mins). (N). Quantification analysis of the fluorescence signals in the TM region after cell transplantation for 0, 12, 24, and 48 hours. Data shown represent means ± SD.
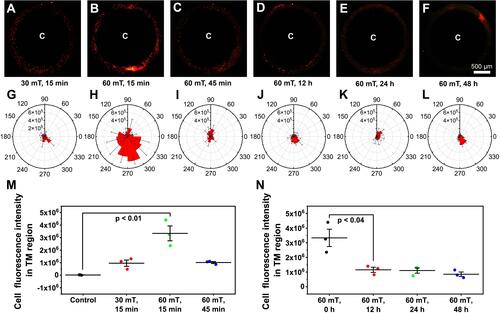
Figure 11 High-resolution of MRI tracking in vivo. (A). Representative images of eyes by MRI. Left-right: Control (no injection), No Magnet; 12 hour after receiving PSC NP-labeled miPSC-TM, Magnet; 12 hours, 1, 3, and 7 days after receiving PSC NP-labeled miPSC-TM cells. The grayscale values in the red circles are analyzed using ImageJ. (B). Quantification analysis of the grayscale values in the TM regions. The magnet facilitates the accumulation of PSC NP-labeled miPSC-TM cells at the TM. **P < 0.01 by one-way ANOVA. (C). Quantification analysis of the grayscale values in the TM region after receiving cells for 1, 3, 7 days. No significant difference is observed. Data shown represent means ± SD.
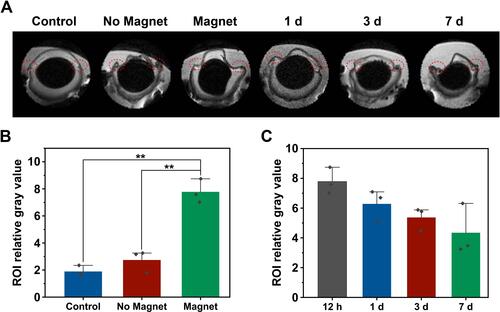
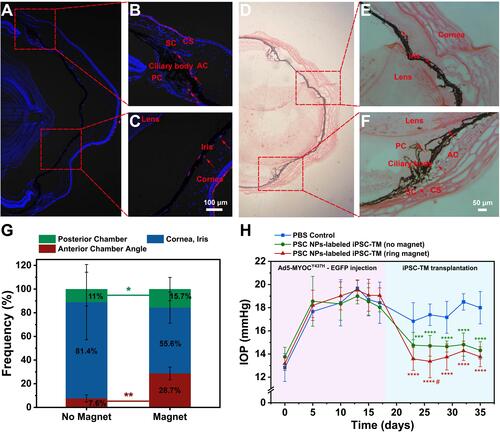
Figure 12 Histological assessment and functional test of PSC NP-labeled iPSC-TM in the eye. (A–C). Representative images of IHC staining using eyes 12 hours after receiving PSC NP-labeled miPSC-TM guided by the magnet (60 mT, 15 mins). Arrows point at the transplanted cells in red fluorescence and nuclei are labeled with DAPI (blue). The landmarks in the eye are labeled including schlemm’s canal (SC), anterior chamber (AC), posterior chamber (PC), cornea stroma (CS), ciliary body, cornea, and iris. (D–F). Representative images of Prussian blue staining 12 hours after the eyes received magnet-assisted (60 mT, 15 mins). PSC NP-labeled cells in blue are pointed by the arrows. The cytoplasm is stained with Eosin. The magnetic field steers the transplanted cells to both the anterior and posterior segments. (G). Quantitation of transplanted cells in the anterior chamber, posterior chamber, cornea, and iris with or without the magnetic guide. A ring magnet adjacent to the TM can significantly improve cell delivery efficiency to the anterior segment (28.7% vs 7.6%, *P < 0.01 in red) as well as the posterior segment (15.7% vs 11.0%, **P < 0.05 in green) and decrease the portion of cells delivered to the cornea and iris (55.6% vs 81.4%, P = 0.18). Three eyes (12 sections/eye) are analyzed in each group. *P < 0.05, **P < 0.01 by one-way ANOVA. Data are expressed as the mean ± SD. (H). IOP measurement in C57BL/6 mice receiving Ad5-MYOCY437H-EGFP and subsequently receiving injections of PBS, PSC NP-labeled iPSC-TM with or without the guide of a ring magnet (n=9 eyes for each group). #P < 0.05, **P < 0.01, ***P < 0.001, ****P < 0.0001 by two-way ANOVA (green asterisks: no magnet vs PBS control; red asterisks: ring magnet vs PBS control; red pound: ring magnet vs no magnet).