Figures & data
Scheme 1 Schematic illustration for configuration and principle of the cTnI determination.
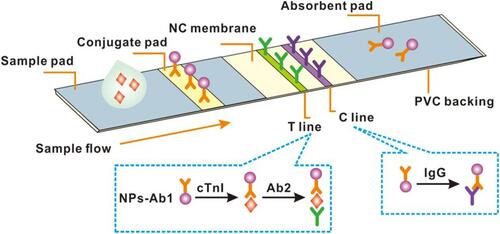
Figure 1 SEM images of GdVO4:30% Eu NPs. (A) Scale bar = 1 μm and (B) scale bar = 100 nm. TEM images of GdVO4:30% Eu NPs with different molar of Cit3-/Gd3+ (C) 4:1, (D) 3:1, (E) 2:1. Inset of b: DLS of the GdVO4:30% Eu NPs. Inset of c: HRTEM image of GdVO4:30% Eu NPs (scale bar = 5 nm).
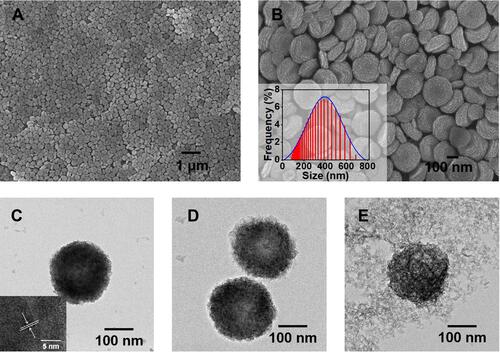
Figure 2 (A) The excitation spectrum (black line) and emission spectrum (red line) of GdVO4:30% Eu NPs. (B) The PL decay from 5D0 of the NPs emission monitoring at 618 nm.
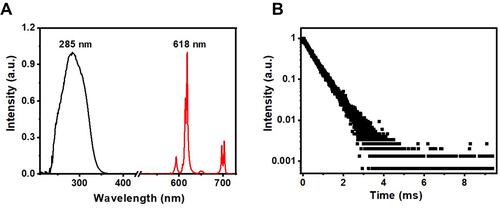
Table 1 Comparison of Various Methods for cTnI Determination
Figure 3 (A) The photos of LFA system toward different-concentration cTnI standards under UV light excitation. From left to right, the concentrations are 2.5, 0.25, 0.025 and 0 ng mL−1 in order. (B) Calibration curve between the relative fluorescence intensity (T/C) versus the cTnI concentration.
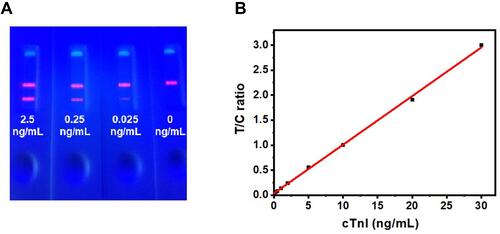
Table 2 The Reproducibility Results of the Developed LFA Strip
Table 3 The Specificity Results of the Developed LFA Strip with Interferents on cTnI Detection
Figure 4 Fluorescence intensity decay rate of the LFA strip at different repeat times. Black dots: GdVO4 NPs probe; red dots: Polystyrene microsphere.
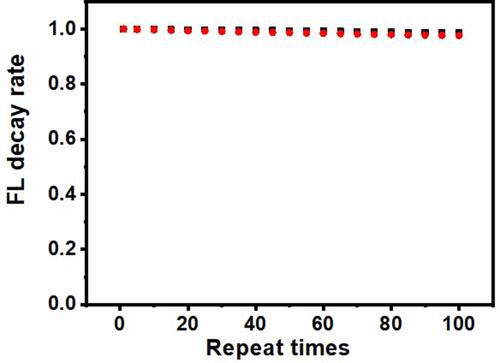
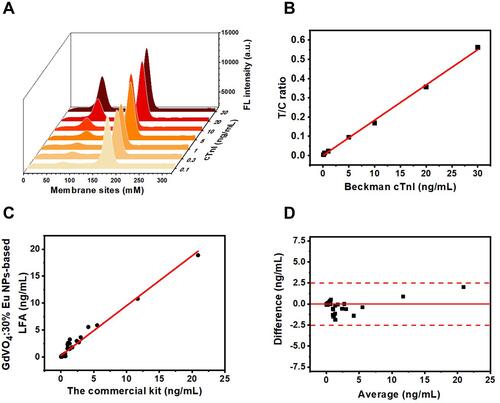
Figure 5 (A) The fluorescence signals of various concentrations of cTnI ranging from 0.1–30 ng mL−1 spiked in Beckman cTnI quality control serum samples at different sites on the NC membrane. (B) Linear regression analysis of cTnI in Beckman quality control serum samples. (C) Correlation between the LFA kit based on GdVO4:30% Eu NPs and commercial kit for the determination of cTnI in 86 serum samples. (D) The difference between the developed LFA kit value and the commercial kit.