Figures & data
Figure 1 The structures of Soluplus® and CPD 23, and scheme illustration of CPD 23@micelles preparation.
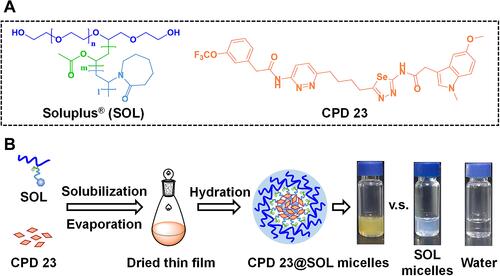
Table 1 The Encapsulation Capacity and Appearance of the Formulated CPD 23@SOL Micelles
Table 2 The Average Particle Sizes, PDI and Zeta Potentials of the Formulated CPD 23@SOL Micelles
Figure 2 The particle size characterizations of CPD 23@SOL micelles and blank SOL micelles.
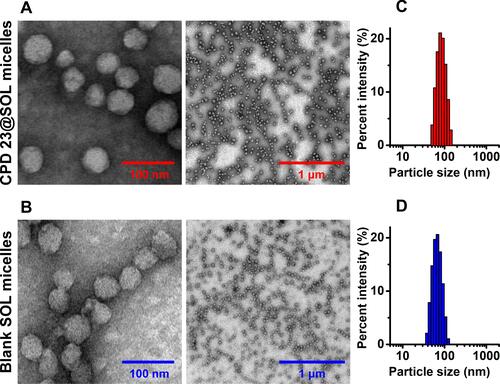
Figure 3 The identification of CPD 23 and CPD 23@SOL solid dispersion by XRPD.
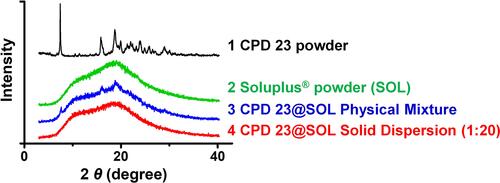
Figure 4 The in vitro inhibition of free CPD 23 and CPD 23@SOL micelles to (A) H22 mouse hepatoma cells and (B) A549 human non-small cell lung cancer cells by EZMTT assay.
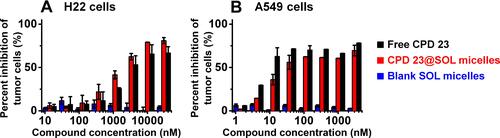
Figure 5 The stability of free CPD 23 and CPD 23@SOL micelles in blood and their partitions in plasma and blood cell pellets.
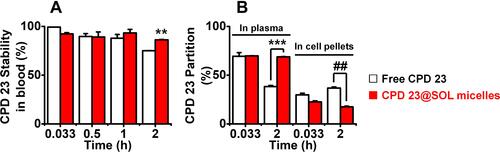
Table 3 The T1/2 and Clearance Rates of Free CPD 23, CPD 23@SOL Micelles and Coumarin in Mouse Liver Microsome
Figure 6 The stability of free CPD 23 and CPD 23@SOL micelles in mouse liver microsome.
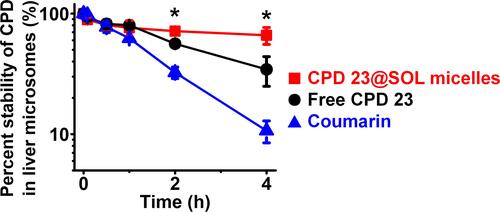
Table 4 The Pharmacokinetic Parameters of CPD 23 Vehicle and CPD 23@SOL Micelles
Figure 7 The AUC (Conc.-time) curves of in vivo pharmacokinetics of CPD 23 vehicle and CPD 23@SOL micelles via intravenous administration with dose of 20 mg/kg.
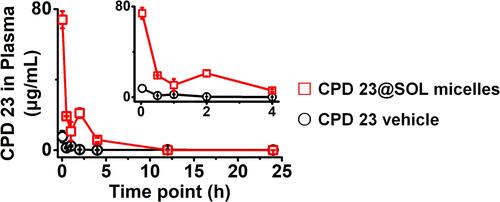
Figure 8 The biodistribution of CPD 23 vehicle and CPD 23@SOL micelles in tissues of (A) brain, (B) heart, (C) liver, (D) spleen, (E) lung and (F) kidney via intravenous administration at the dose of 20 mg/kg CPD 23.
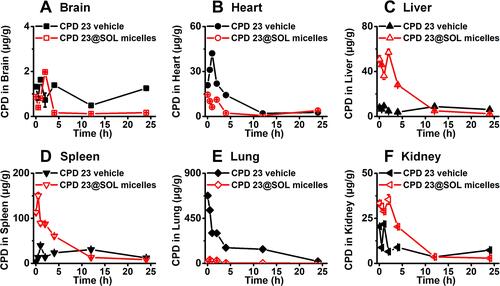
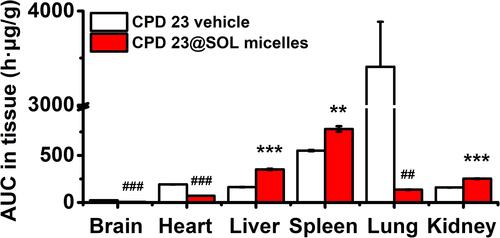
Figure 9 The tissue biodistributed AUC0-24 h of CPD 23 vehicle and CPD 23@SOL micelles by intravenous administration of 20 mg/kg dose (CPD 23).