Figures & data
Table 1 Primer Sequences for Quantitative RT-PCR
Figure 1 Characterization of human periodontal ligament stem cell-derived small extracellular vesicles (P-EVs) and delivery by Matrigel. (A) Morphology of P-EVs observed via transmission electron microscopy (TEM). Scale bar = 100 nm. (B) Particle size distribution of P-EVs measured by nanoparticle tracking analysis (NTA): mean size ± standard deviation of P-EVs was 113.5 ± 32.25 nm. (C) Western blot analysis of P-EV surface markers. (D) Preparation of the mixture of P-EVs and Matrigel on ice. (E) Gross appearance of P-EV/Matrigel on ice and at 37°C. (F) Scanning electron microscopy (SEM) image of P-EV/Matrigel and PBS/Matrigel. Scale bar = 100 µm (left) and 2 µm (right). (G) Confocal laser microscopy images of P-EV/Matrigel are shown in angled three-dimensional and z-stack views (Width 636.19µm, Height 636.19µm, Depth 64µm).
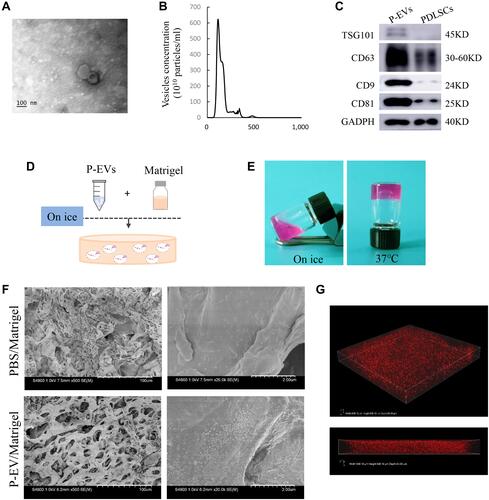
Figure 2 Formation of a bilateral critical-sized calvarial defect model and local transplantation of periodontal ligament stem cell-derived small extracellular vesicles (P-EVs). (A) Diagram of isolation and local transplantation of P-EVs. (B) In both sides of the calvaria, full-thickness bone defects (diameter = 5 mm) were created using a trephine drill. Either of the calvarial defects was filled with P-EVs immobilized in Matrigel (P-EV/Matrigel) randomly, and the other was filled with Matrigel incorporated with phosphate-buffered saline (PBS) (PBS/Matrigel) as the control. (C) Representative three-dimensional reconstruction and sagittal images of calvarial defects at 10 weeks posttransplantation. (D) Bone volume/tissue volume (BV/TV) and (E) bone mineral density (BMD) of the control and P-EVs group. P-EV/Matrigel increased bone repair in rat critical-sized calvarial defects. *P < 0.05, **P < 0.01.
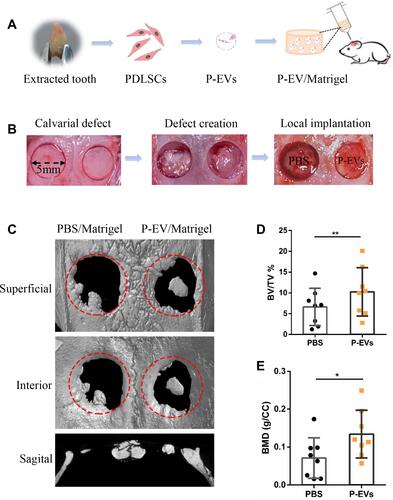
Figure 3 Histological analysis of bone repair on both sides of the bilateral calvarial bone defects in a rat model. (A) Formation of new bone-like tissue was confirmed histologically in the hematoxylin and eosin-stained defects on both sides. Few undegraded gels were observed, and bone repair was achieved on both sides. On the control side, Matrigel transplantation induced minimal osteoid formation (black big arrow) in the defect area. On the P-EV/Matrigel side, evident deposition of osteoid was observed, and osteoid calcification leading to bone formation was observed in the middle of the defect area. Embedded osteocyte-like cells (thin arrow) in the calcified osteoid were observed. (B) Corresponding Masson’s trichrome staining. On the control side, the margins of the defects were connected via a thin dense connective fibrous tissue. On the P-EV/Matrigel side, the defect was occupied by dense fibrous connective tissue with bone-like tissue. On the P-EV/Matrigel side, osteocyte-like cells (thin arrow) were embedded in the newly immature bone tissue. PBS, phosphate-buffered saline; P-EV, periodontal ligament stem cell-derived small extracellular vesicle. Scale bar =500 µm (in 20× images), 100 µm (in 100× images) and 20 µm (in 400× images).
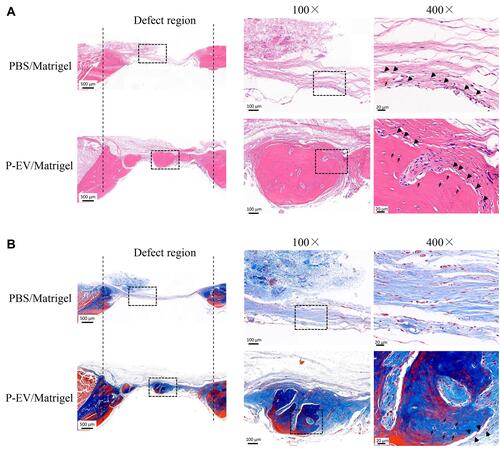
Figure 4 Evaluation of cell proliferation in the bone repair area. (A–C) Immunohistochemical staining of proliferative cell nuclear antigen (PCNA) in the control side. (D–F) More PCNA+ cells were found in the side treated with periodontal ligament stem cell-derived small extracellular vesicles (P-EVs). Black boxes indicate the region near the host bone, and the dotted boxes indicate the region in the middle of the defect. (A and D) scale bar = 200 µm (in); (B and C, E and F) scale bar = 20 µm. (G) Quantitative analysis of PCNA+ cells on both sides of the bilateral calvarial bone defects in a rat model. PCNA+ cells were counted under 200× magnification and expressed as the percentage of positively stained cells. Data are expressed as mean ± standard deviation (representative images, n = 5). **P < 0.01.
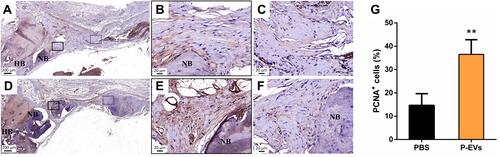
Figure 5 Cellular uptake assay of periodontal ligament stem cell-derived small extracellular vesicles (P-EVs) by bone marrow mesenchymal stem cells (BMMSCs). (A) BMMSCs were incubated with PKH26-labeled P-EVs (red) for 1, 4, 24, 48 and 72 h at 37 °C. Confocal microscopy images demonstrated rapid uptake of P-EVs. The cells were stained for F-actin (green) and nucleus (blue). Scale bar = 50 µm (B) Merged images at high magnification revealed cytoplasmic localization of P-EVs. Scale bar = 20 µm. (C) Graph showing the gradual internalization of P-EVs by BMMSCs within 72 h. The red line indicates a fitting curve to the data with nonlinear regression, suggesting saturable P-EV endocytosis. Relative fluorescence intensity was expressed as mean ± standard deviation (n = 5).
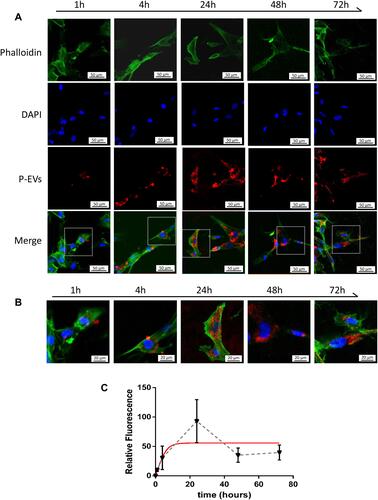
Figure 6 Effects of periodontal ligament stem cell-derived small extracellular vesicles (P-EVs) on bone marrow mesenchymal stem cell (BMMSC) proliferation and migration. (A) Growth curves of BMMSCs were measured using a cell counting kit-8 (CCK-8) assay kit. (B) Representative images of 5-bromo-2ʹ-deoxyuridine (BrdU) assay. Scale bar = 100 µm. (C) BrdU assay showed a significant effect of P-EVs on BMMSC proliferation. *P < 0.05. (D) Quantitative RT-PCR analysis of genes associated with cell survival and proliferation. (E and F) P-EV treatment significantly enhanced cell migration when compared with vehicle treatment, in a dose-dependent manner. Migration rates of P-EV-treated BMMSCs were significantly higher than those of vehicle-treated cells. (E) scale bar = 100 µm. (G and H) Representative photomicrograph of the wound edge during the scratch assay at 0, 12 and 24 h after the treatment with P-EVs and vehicle. The migration rate of BMMSCs is represented as percent scratch closure. (G) scale bar = 200 µm. Each bar represents mean ± standard deviation values from three independent experiments. *P < 0.05, **P < 0.01, and ***P < 0.001 compared to PBS treatment at 12h. ##P < 0.01 and ###P < 0.001 compared to PBS treatment at 24h. Pairwise one-tailed Student’s t-tests were used for statistical analysis.
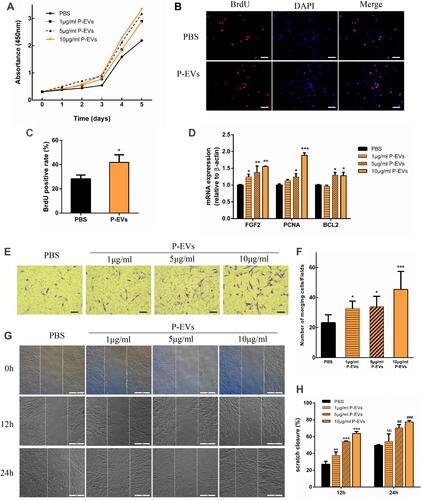
Figure 7 Periodontal ligament stem cell-derived small extracellular vesicle (P-EV) mediated partial activation of Akt and Erk1/2 phosphorylation through adenosine signaling. (A–C) After P-EV treatment, intracellular signaling in BMMSCs showed rapid activation of the Akt and Erk1/2 signaling pathways. *P < 0.05 compared to phosphate-buffered saline (PBS) treatment, **P < 0.01 compared to PBS treatment, #P < 0.05 compared to P-EV treatment after 60 min. (D–F) Western blot analysis revealed that pretreatment with theophylline (1 mM), a non-selective adenosine receptor antagonist, attenuated Akt phosphorylation by 2.7 folds and Erk1/2 phosphorylation by 1.4 folds. *P < 0.05, **P < 0.01, and***P < 0.001 compared to PBS treatment, #P < 0.05 compared to theophylline + P-EV treatment. Representative results from three independent experiments are expressed as mean ± standard deviation.
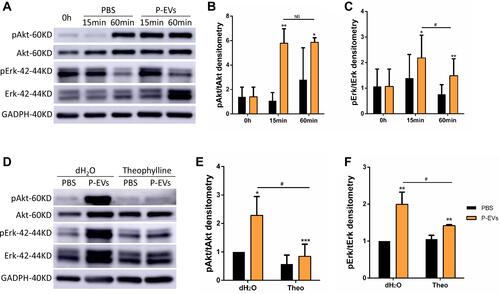
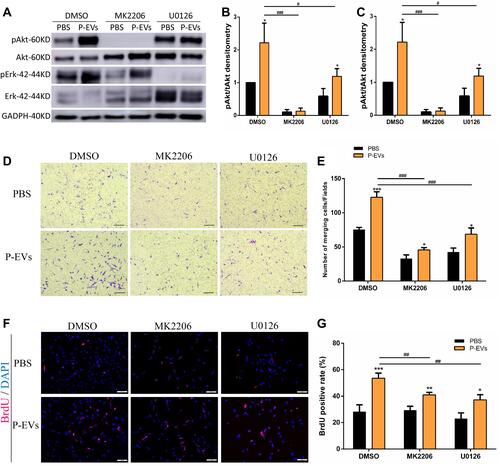
Figure 8 Periodontal ligament stem cell-derived small extracellular vesicle (P-EV)-mediated activation of Akt and Erk1/2 signaling and their effects on BMMSC migration. (A–C) Western blotting results showed that pretreatment with Akt inhibitor (MK2206, 10 µM) and Erk1/2 inhibitor (U0126, 10 µM) suppressed P-EV-induced Akt and Erk1/2 activation. *P <0.05 compared to phosphate-buffered saline (PBS) treatment, #P <0.05 and ###P < 0.001 compared to P-EV treatment. (D–E) AKT and ERK1/2 inhibition suppressed P-EV-induced cell migration. (D) scale bar = 100 µm. *P < 0.05 and ***P < 0.001 compared to PBS treatment, ###P < 0.001 compared to P-EV treatment. (F and G) BrdU immunofluorescence assay showed that AKT and ERK1/2 inhibition suppressed P-EV-induced cell proliferation. (F) scale bar = 100 µm. *P < 0.05, **P < 0.01 and ***P < 0.001 compared to PBS treatment. ##P < 0.01 compared to P-EV treatment. Representative results from independent experiments are expressed as the mean ± standard deviation.