Figures & data
Figure 1 (A) The synthesis process: end-group conversion of PBMAx-b-PNAMy block copolymer (x/y = 73/51) by reversible addition–fragmentation chain-transfer polymerization. (B) Composition characterization of PBMA75-b-PNAM51 by proton nuclear magnetic resonance spectroscopy using chloroform-d as the solvent.
Abbreviations: PBMAx-b-PNAMy, poly(n-butyl methacrylate)x-b-poly(N-acryloylmorpholine)y; THF, tetrahydrofuran.
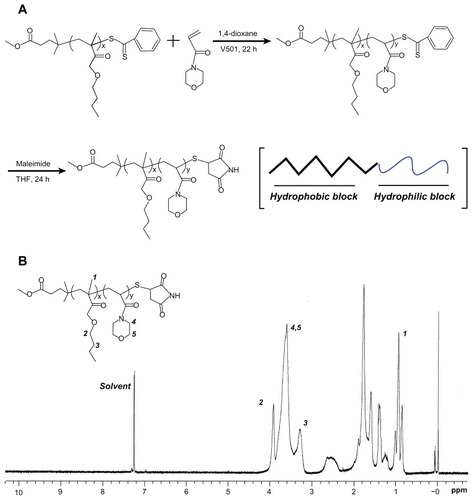
Figure 2 (A) The conditions for vesicle formation, the hydrodynamic diameter, and the size distribution of the corresponding PBMA75-b-PNAM51 vesicle and its cytotoxicity profile in aqueous solution. (B) Transmission electron microscopy image of the morphology of the well-defined vesicles with hydrophilic hollow inner space and hydrophobic bilayer and structural confirmation by nuclear magnetic resonance spectroscopy.
Abbreviations: PBMA75-b-PNAM51, poly(n-butyl methacrylate)x-b-poly(N-acryloylmorpholine)y, with hydrophobic to hydrophilic block ratio regulated at 73/51; PEI, polyethylenimine.
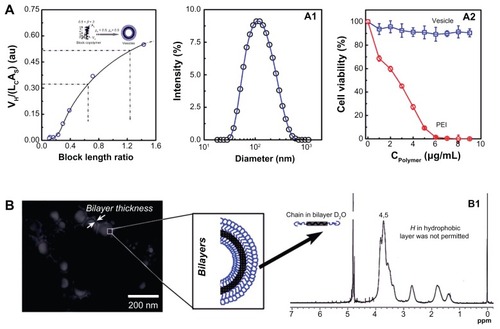
Figure 3 (A) Plasmid DNA (pDNA) condensation: DNA I enzyme-degradation protection profile analysis by 0.7% agarose gel retardation assay. Bands m (the marker), r, d, p, and v were the pDNA control, polyethylenimine (PEI)/pDNA, polymer/pDNA and vesicle/pDNA incubated with no enzyme, respectively; re, de, pe, and ve were pDNA control, PEI/pDNA, polymer/pDNA and vesicle/pDNA incubated with DNA enzyme, respectively. (B) pDNA condensing and releasing profiles of PEI, PBMA75-b-PNAM51 block copolymer, and vesicles at 10 mg/mL. (C) The heparin concentration dependence of the pDNA release for PEI/pDNA (bands c0–c4) and vesicle/pDNA (d0–d4).
Abbreviation: PBMA75-b-PNAM51, poly(n-butyl methacrylate)x-b-poly(N-acryloylmorpholine)y, with hydrophobic to hydrophilic block ratio regulated at 73/51.

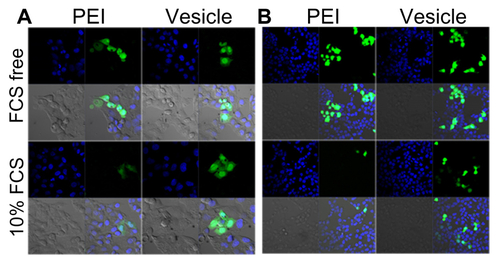
Figure 4 Plasmid DNA transferring comparison between polyethylenimine PBMA75- b-PNAM51 block copolymer vesicle for 293T (A) and HepG2 (B). Transference was indicated by inverse fluorescent microscopy either with or without fetal bovine serum (FBS).
Abbreviation: PBMA75-b-PNAM51, poly(n-butyl methacrylate)x-b-poly(N-acryloylmorpholine)y, with hydrophobic to hydrophilic block ratio regulated at 73/51.
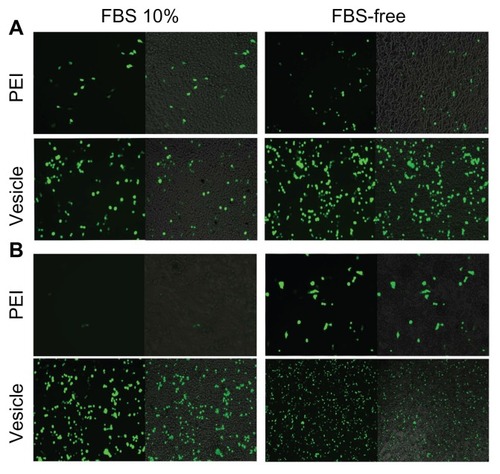
Figure 5 Quantum dot (QD) transferring efficiency comparison between polyethylenimine (PEI) and the vesicle for 293T cells either with or without fetal bovine serum (FBS).
Notes: The nuclei were stained with 4′,6-diamidino-2-phenylindole (DAPI), giving a blue color. The red color was generated by the QDs.
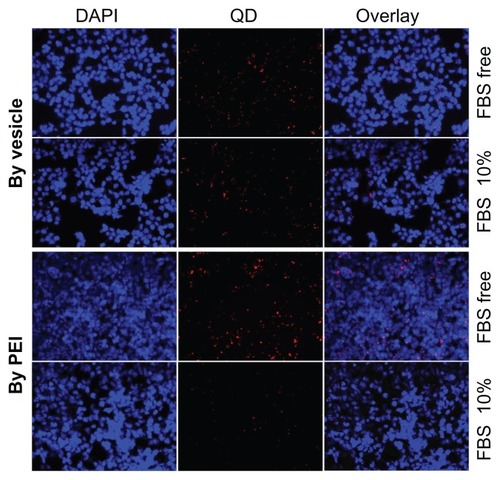
Figure 6 (A) The positive ratio of quantum dot (QD)-605 and pEGFP-N1 transferred by vesicle for 293T and HepG2 cells using the same method and at the same concentration in the medium either with or without fetal bovine serum (FBS). (B) Scattergraphs for QD-605 and plasmid DNA transferred by vesicle for 293T cells either with or without FBS.
Abbreviations: FSC, forward scatter; SSC, side scatter.
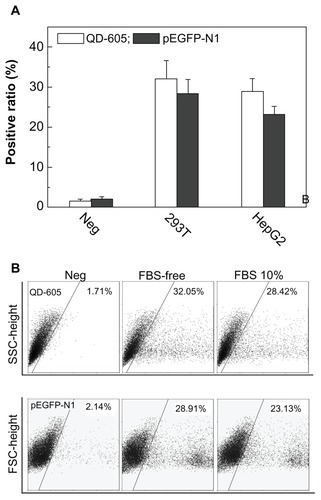
Figure 7 The scheme illustrated complexation between carrier (polyethylenimine [PEI] and vesicles) and plasmid DNA (pDNA). (A) shows the hydrodynamic and kinetic conditions for well-defined vesicle formation, pDNA condensing, and the properties of the corresponding stealth polyplex; (B) shows the polyplex formation by cationic PEI with pDNA and the corresponding size and surface properties of the polyplex.
Note: The dimensions of the drawn polyplex do not reflect its real size.
![Figure 7 The scheme illustrated complexation between carrier (polyethylenimine [PEI] and vesicles) and plasmid DNA (pDNA). (A) shows the hydrodynamic and kinetic conditions for well-defined vesicle formation, pDNA condensing, and the properties of the corresponding stealth polyplex; (B) shows the polyplex formation by cationic PEI with pDNA and the corresponding size and surface properties of the polyplex.Note: The dimensions of the drawn polyplex do not reflect its real size.](/cms/asset/a7d165b6-418e-4ddc-b775-b4eb29ed9f0e/dijn_a_34675_f0007_c.jpg)
Figure 8 (A) The size and size distribution of plasmid DNA (pDNA), vesicles, and corresponding polyplexes – polyethylenimine (PEI)/pDNA and vesicle/pDNA. (B) The serum stability profile of the vesicles and PEI was evaluated by bovine serum albumin (BSA) measured by dynamic light scattering. (C) The scheme illustrating the mechanism of the surface properties on the stability of the PEI/BSA and vesicle/BSA polyplexes in aqueous solution.
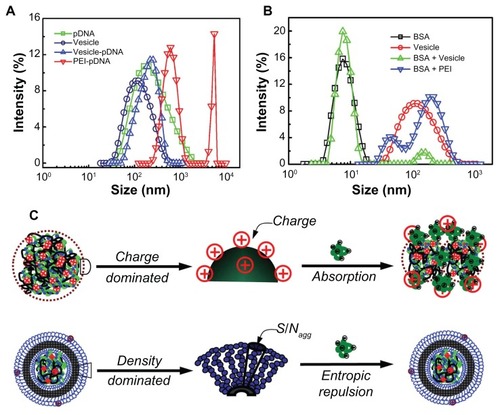
Figure 9 Successfully established tumor xenograft model (A). The passive targeted in vivo tumor accumulation of fluorescein isothiocyanate delivered by polyethylenimine (PEI)- and vesicle-based polyplexes (B and C, respectively) under the same conditions.
Note: All the images were observed by the IVIS® Lumina II Imaging System (Caliper Life Sciences, Hopkinton, MA).
Abbreviation: ROI, region of interest.
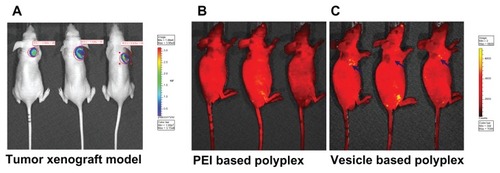
Figure S1 Gel permeation chromatography characterization of macromolecular reversible addition–fragmentation chain-transfer radical polymerization agent and the corresponding block copolymer poly(n-butyl methacrylate) [PBMA]-poly (N-acryloylmorpholine).
![Figure S1 Gel permeation chromatography characterization of macromolecular reversible addition–fragmentation chain-transfer radical polymerization agent and the corresponding block copolymer poly(n-butyl methacrylate) [PBMA]-poly (N-acryloylmorpholine).](/cms/asset/02194d06-ef5a-4971-8248-4c63ed12046d/dijn_a_34675_sf0001_c.jpg)
Figure S2 Transmission electron microscopy image of the vesicle/plasmid DNA (pDNA) polyplex.
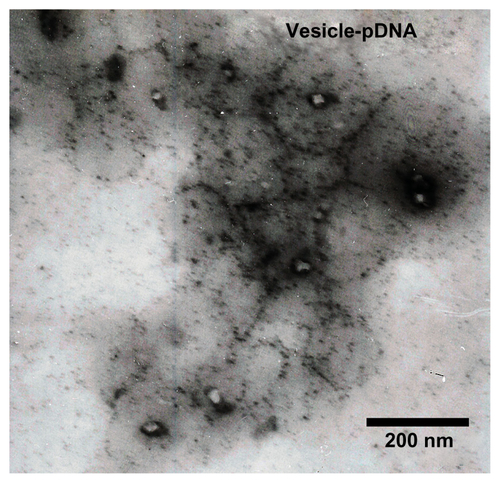
Figure S3 Plasmid DNA transferring comparison using polyethylenimine (PEI) for 293T (A) and HepG2 (B) cell lines, observed by inverse fluorescent microscopy either with (N/P = 10) or without filtration (N/P = 10 − F) in fetal bovine serum-free medium.
Abbreviation: N/P, nitrogen-from-PEI/phosphate-from-DNA ratio.
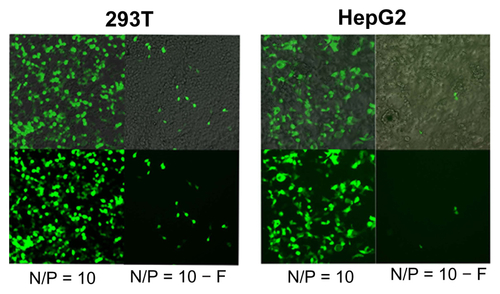
Figure S4 Plasmid DNA transferring comparison between polyethylenimine and PBMA75-b-PNAM51 block copolymer vesicle HepG2 (A) and 293T (B) cell lines, as indicated by confocal laser scanning microscopy either with or without fetal bovine serum.
Abbreviation: PBMA75-b-PNAM51, poly(n-butyl methacrylate)x-b-poly(N-acryloylmorpholine)y, with hydrophobic to hydrophilic block ratio regulated at 73/51.