Figures & data
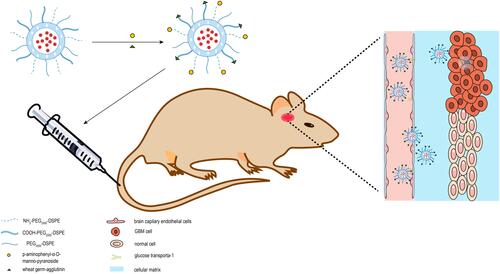
Figure 1 Overall schematic representation for the preparation of epirubicin plus resveratrol liposomes modified with p-aminophenyl-α-D-manno-pyranoside (MAN) and wheat germ agglutinin (WGA).
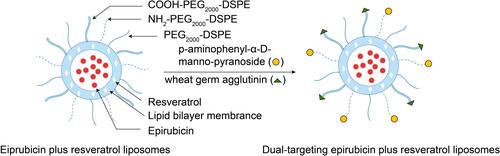
Figure 2 Morphology of different epirubicin liposomes observed by atomic resolution analytical transmission electron microscopy (×600). (A) Blank liposomes; (B) epirubicin liposomes; (C) epirubicin plus resveratrol liposomes; (D) epirubicin plus resveratrol liposomes; (E) epirubicin plus resveratrol liposomes modified with WGA; (F) epirubicin plus resveratrol liposomes modified with WGA and MAN.
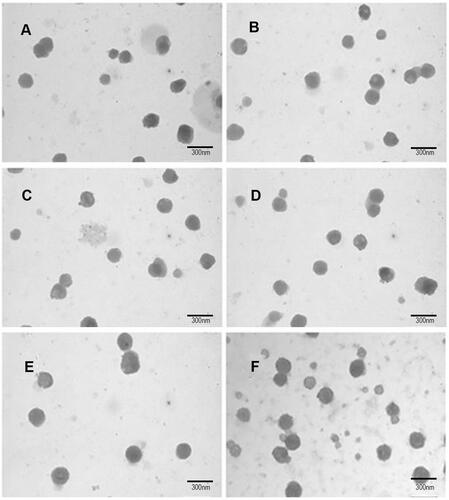
Figure 3 Antiproliferative effect against C6 glioma cells by different epirubicin plus resveratrol liposomes (Mean ± SD).
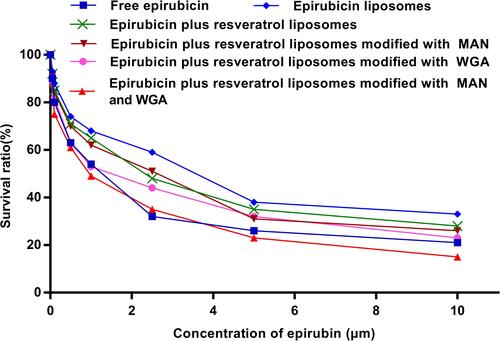
Figure 4 Drug uptake in C6 glioma cells following applying epirubicin formulations by FAScan flow cytometry assay. *P < 0.05; **P < 0.01; n.s.: no statistical significance.
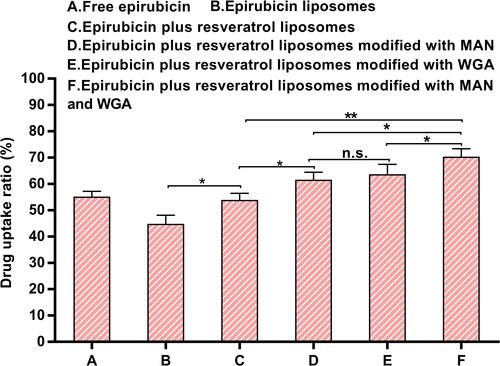
Figure 5 The profiles of apoptosis effect against C6 glioma cells were obtained by FAScan flow cytometer following applying different epirubicin formulations. (A) Free epirubicin; (B) epirubicin liposome; (C) epirubicin plus resveratrol liposomes; (D) epirubicin plus resveratrol liposomes modified with MAN; (E) epirubicin plus resveratrol liposomes modified with WGA; (F) epirubicin plus resveratrol liposomes modified with WGA and MAN.
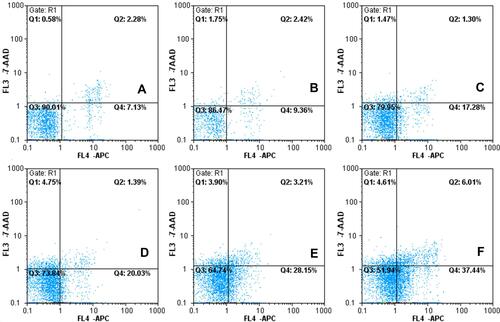
Figure 6 Cellular localization of multifunctional targeting liposomes in C6 glioma cells by laser scanning confocal microscopy. A ⅰ-E ⅰ: Red color shows the epirubicin in C6 glioma cells after applying free epirubicin (A ⅰ) epirubicin plus resveratrol liposomes (B ⅰ) epirubicin plus resveratrol liposomes modified with MAN (C ⅰ) epirubicin plus resveratrol liposomes modified with WGA. (D ⅰ) epirubicin plus resveratrol liposomes modified with WGA and MAN (E ⅰ), respectively; A ⅱ-E ⅱ: Blue color indicates the nucleus of C6 glioma cells stained with Hoechst-33258; A ⅲ-E ⅲ: Overlapping images of A ⅰ-A ⅱ, B ⅰ-B ⅱ, C ⅰ-Cⅱ, D ⅰ-D ⅱ, and E ⅰ-E ⅱ, respectively.
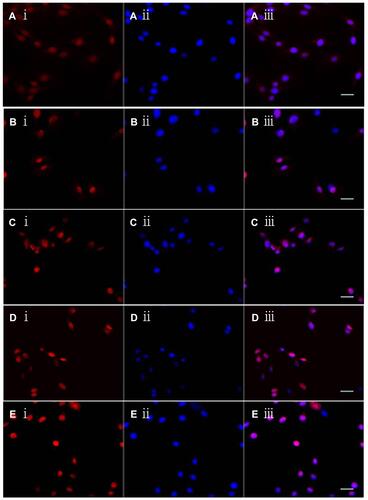
Figure 7 The transport ratios (%) across the BBB in vitro of epirubicin plus resveratrol liposomes modified with MAN and WGA. (A) The transport ratios (%) across the BBB during 24 h; (B) the transport ratios (%) across the BBB with the competition assay that the BBB was preconditioned with free MAN for 30 min, and followed by applying epirubicin plus resveratrol liposomes modified with WGA and MAN or epirubicin plus resveratrol liposomes modified with MAN at designated time-points, respectively. Data are presented as the mean ± standard deviation (SD). * P< 0.05; ** P < 0.01; *** P < 0.001; **** P < 0.0001.
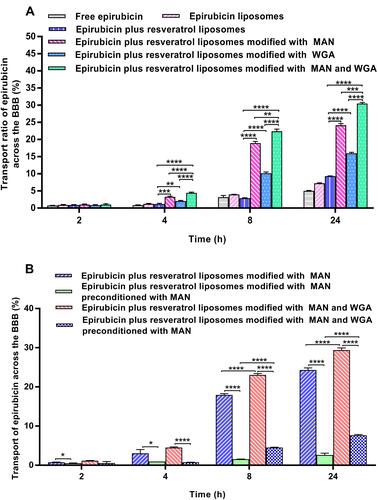
Figure 8 Morphological changes of C6 glioma spheroid volume after treatment of epirubicin formulations (×100).
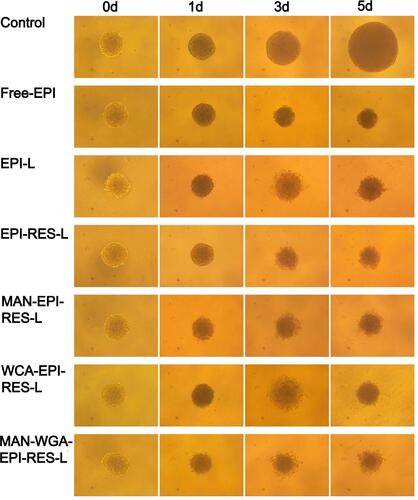
Figure 9 The C6 glioma spheroid volume ratio after beingtreated with different epirubicin formulations. (A) Control group; (B) free epirubicin; (C) epirubicin liposomes; (D) epirubicin plus resveratrol liposomes; (E) epirubicin plus resveratrol liposomes modified with MAN; (F) epirubicin plus resveratrol liposomes modified with WGA; (G) epirubicin plus resveratrol liposomes modified with WGA and MAN. * P < 0.05; ** P < 0.01; **** P< 0.0001.
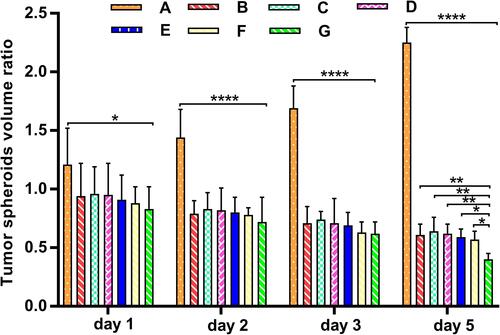
Figure 10 The multifunctional targeting effects: inhibitory rate of epirubicin plus resveratrol liposomes modified with WGA and MAN against C6 glioma cells following transport across the BBB in vitro. Data are presented as the mean ± standard deviation (SD). ** P < 0.01; *** P < 0.001; **** P < 0.0001.
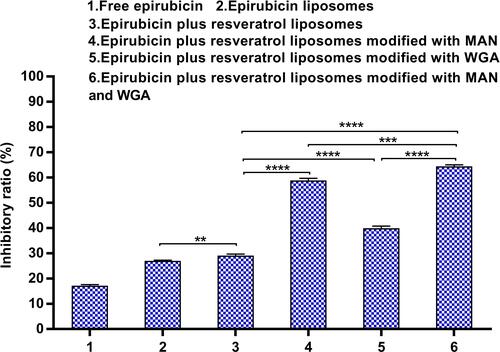
Figure 11 The C6 glioma spheroid volume ratio of different epirubicin liposomes across the BBB in a co-culture model of BBB/C6 glioma spheroid. Data are presented as the mean ± standard deviation (SD). *P < 0.05; ** P < 0.01; *** P < 0.001, n.s.: no statistical significance.
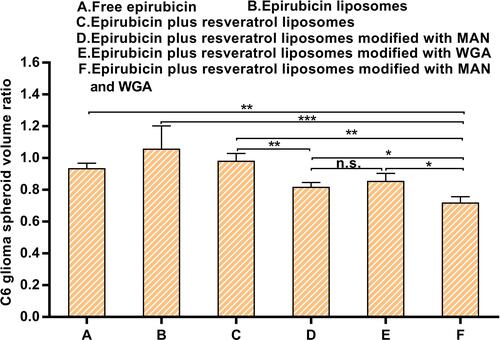
Figure 12 The tumor volume inhibitory ratio (%) in the C6 glioma-bearing rat after administration of epirubicin plus resveratrol liposomes modified with WGA and MAN. Data are presented as the mean ± standard deviation (SD). * P < 0.05; ** P < 0.01; **** P< 0.0001.
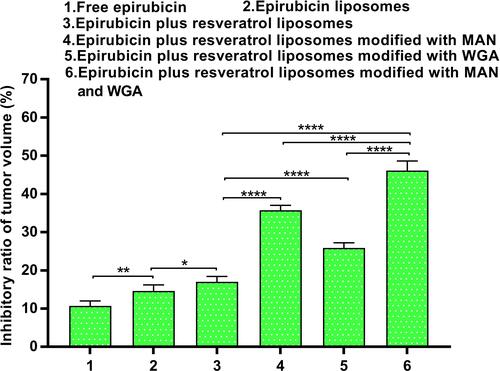
Figure 13 The pathological images of C6 glioma-bearing rats by HE staining. (A) Complete brain pathology, ×4 (phosphate saline). (B) Invasion growth of brain tumor, ×100 (Free EPI). (C) Tumor cells and tumor cell clusters on the edge of the brain tumor, ×100 (epirubicin liposomes). (D) Numerous hemorrhage and necrosis areas in the tumor site, ×10 (epirubicin plus resveratrol liposomes). (E) A reduced cellularity and vacuolated matrix, ×400;(epirubicin plus resveratrol liposomes modified with WGA and MAN). (F) Recurring or residual tumor cell clusters, ×400;(epirubicin plus resveratrol liposomes modified with WGA and MAN).
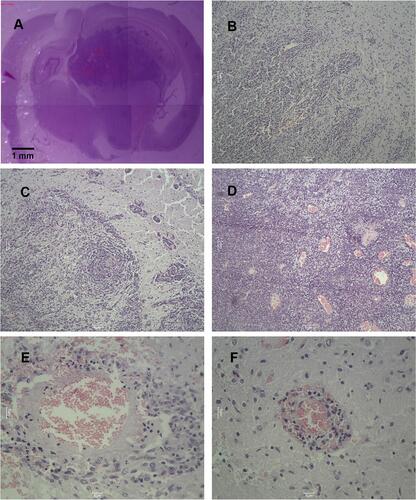
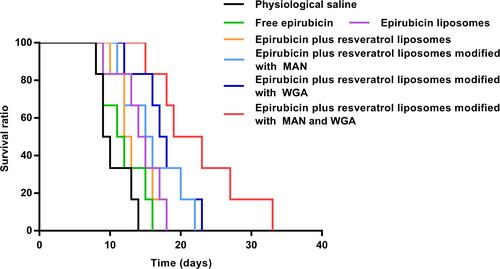
Figure 14 Kaplan–Meier survival curves of C6 glioma-bearing rats (n=6 for each group) treated with epirubicin formulations at days 8, 10, and 12 (one week treatment) after inoculation (each dosing 5 mg/kg epirubicin).