Figures & data
Table 1 Composition of the nanoemulsion formulation
Table 2 Composition of the modified nanoemulsion formulations
Figure 1 Ternary phase diagram of PKOE/Tween 80/water system at 25°C ± 1°C.
Abbreviations: L1, isotropic liquid region; Lc, liquid crystalline region; M, multiphase region; PKOE, palm kernel oil esters.
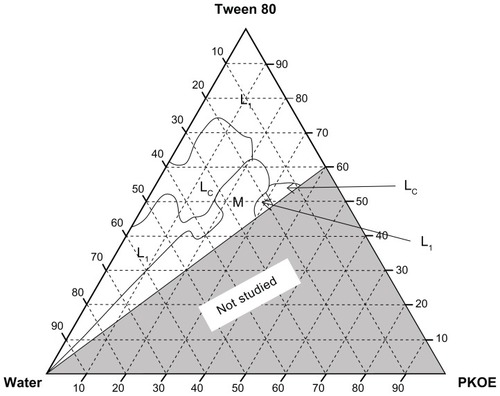
Table 3 Physicochemical properties of the initial nanoemulsion formulation
Figure 2 Droplet size and polydispersity index for the initial nanoemulsion (T802) and the modified nanoemulsion.
Note: Mean ± SD, n = 3.
Abbreviations: Ref, reference; GG, gellan gum; CG, carrageenan; XG, xanthan gum; SD, standard deviation.
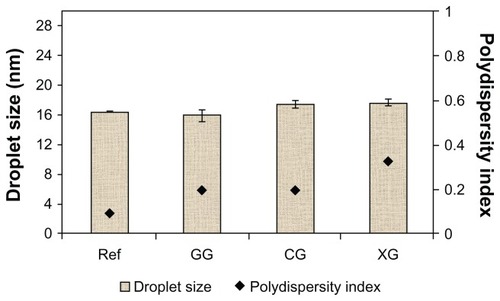
Figure 3 Zeta potential distributions for the nanoemulsion sample T802.
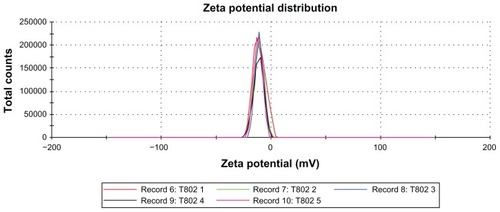
Figure 4 Zeta potential values for the initial nanoemulsion (T802) and the modified nanoemulsion.
Note: Mean ± SD, n = 3.
Abbreviations: Ref, reference; GG, gellan gum; CG, carrageenan; XG, xanthan gum; SD, standard deviation.
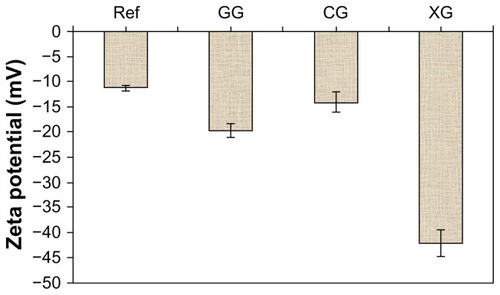
Figure 5 Viscosity versus shear rate for the initial and modified nanoemulsions.
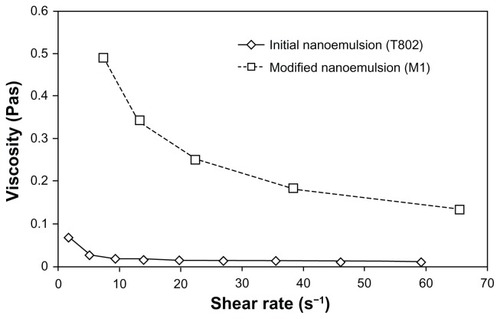
Figure 6 The TEM images of (A) the initial (T802), and (B) the modified (M1) nanoemulsions.
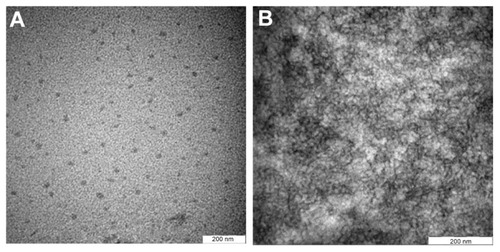
Table 4 The permeation parameters of the initial and modified nanoemulsion
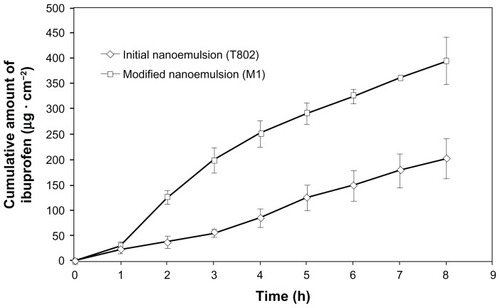
Figure 7 The permeation profiles of ibuprofen through Wistar rat skin.
Note: Mean ± standard deviation, n = 3.