Figures & data
Table 1 Characteristics of CSO-SA and curcumin-loaded CSO-SA micelles
Figure 1 Characterization of curcumin-loaded CSO-SA micelles. (A) Size distribution of curcumin-loaded CSO-SA micelles. (B) Transmission electron microscopic images of curcumin-loaded CSO-SA micelles. (C) Release profile of curcumin from curcumin-loaded CSO-SA micelles in phosphate-buffered solution at 37°C.
Note: Data are presented as the mean ± standard deviation (n = 3).
Abbreviations: Cur, curcumin; CSO-SA, stearic acid-g-chitosan oligosaccharide.
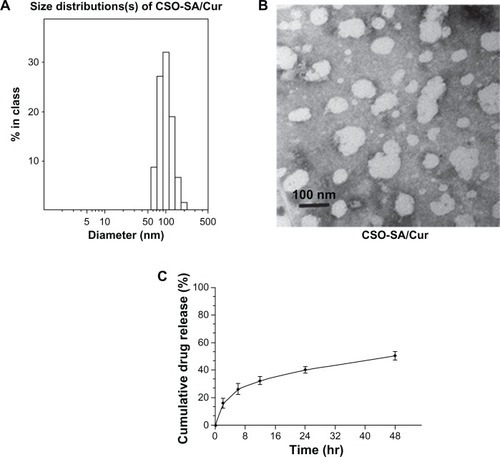
Figure 2 Solubility and stability of CSO-SA/Cur micelles. (A) Free curcumin is poorly soluble in aqueous medium in tube (a). In contrast, CSO-SA/Cur micelles are completely dispersed in aqueous medium in tube (b). (B) Stability test of curcumin in PBS (pH 7.2) and PBS containing 10% FBS.
Note: Data are presented as the mean ± standard deviation (n = 3).
Abbreviations: Cur, curcumin; CSO-SA, stearic acid-g-chitosan oligosaccharide; FBS, fetal bovine serum; PBS, phosphate-buffered solution.
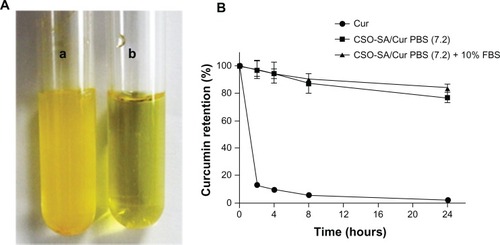
Figure 3 Scanning confocal images of curcumin after incubation of colorectal cancer cells with curcumin or curcumin-loaded CSO-SA micelles for one hour and 4 hours, respectively.
Abbreviations: Cur, curcumin; CSO-SA, stearic acid-g-chitosan oligosaccharide.
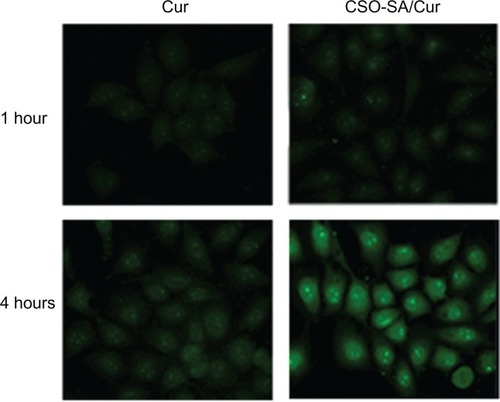
Figure 4 (A) Cytotoxicity of free curcumin and curcumin-loaded CSO-SA micelle solution toward primary colorectal cancer cells. (B) Results for colorectal cancer cells treated with free curcumin solution included as a control.
Note: Data are presented as the mean ± standard deviation (n = 3).
Abbreviations: Cur, curcumin; CSO-SA, stearic acid-g-chitosan oligosaccharide.
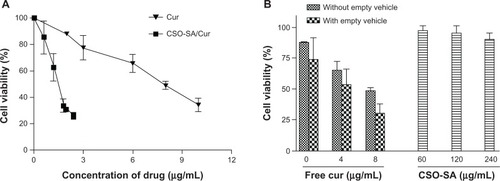
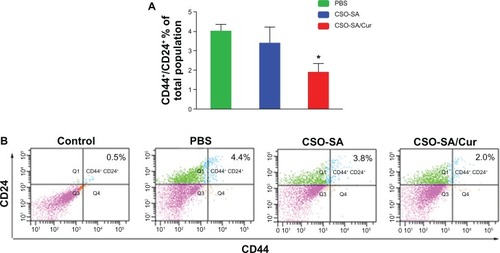
Figure 5 Characterization of cell surface marker expression in primary colorectal cancer cells. (A) Ratio of CD44+/CD24+ cell subpopulation in total cancer cells. Data are presented as the mean ± standard deviation (*P < 0.05, all others versus untreated group). (B) Representative flow cytometry plots for the experiments.
Note: Q2 covers the region of the CD44 and CD24 double-positive cells (isotype control profiles on all channels).
Abbreviations: Cur, curcumin; CSO-SA, stearic acid-g-chitosan oligosaccharide.
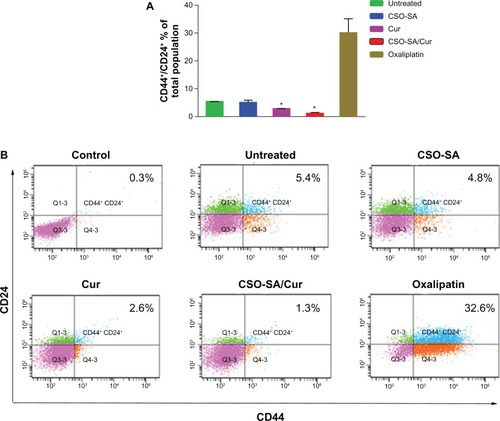
Figure 6 Effect of curcumin-loaded CSO-SA micelles on growth of primary colorectal cancer cells and formation of spheroids.
Note: The size of the spheroids was visualized by microscopy after the cancer cells were exposed to the experimental treatments for 14 days.
Abbreviations: Cur, curcumin; CSO-SA, stearic acid-g-chitosan oligosaccharide.
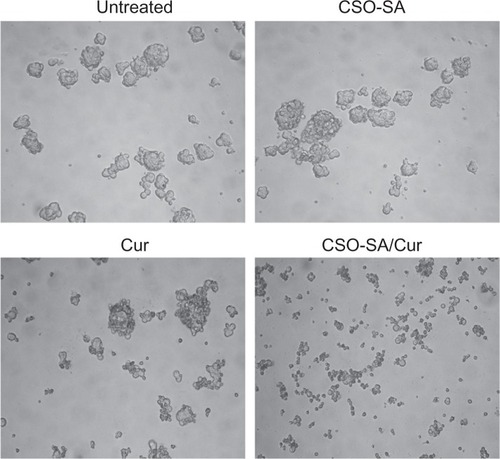
Figure 7 In vivo antitumor activity of curcumin-loaded CSO-SA micelles after intravenous injection via the tail vein in tumor-bearing nude mice. (A) Mice tumor volume changes during the experiment. (B) Changes in mouse body weight during the experiment. (C) Scanning confocal images of curcumin-loaded CSO-SA micelles at 48 hours after the last treatment in xenograft tumor tissues.
Note: Curcumin shows intrinsic green fluorescence.
Abbreviations: Cur, curcumin; CSO-SA, stearic acid-g-chitosan oligosaccharide; PBS, phosphate-buffered solution.
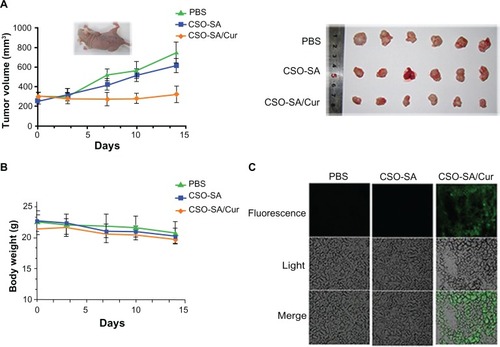
Figure 8 CD44+/CD24+ cell subpopulation in xenograft tumors. (A) Ratio of CD44+/CD24+ cell subpopulation in tumors. The data are presented as the mean ± standard deviation of four tumors per group. *P < 0.05. (B) Representative flow cytometry plots for the experiments.
Note: Q2 covers the region of the CD44 and CD24 double-positive cells (isotype control profiles on all channels).
Abbreviations: Cur, curcumin; CSO-SA, stearic acid-g-chitosan oligosaccharide; PBS, phosphate-buffered solution.