Figures & data
Figure 1 Schematic illustration of orally targeted delivery of L-Arginine based pH-activated “nano-bomb” carrier in hydrogel for site-specific treatment of ulcerative colitis. (A) PS-L-Arg-CO2@NPs (NPs) with pH-activated “nano-bomb effect” were fabricated by double-emulsion technique. Then, the nanoparticles were linked with hyaluronic acid (HA) to endow their active targeting ability (HA-PS-L-Arg-CO2@NPs, HA-PS@NPs). (B) HA-PS@NPs were loaded in chitosan/alginate hydrogel for site-specific treatment of ulcerative colitis by regulating gene silencing and the level of reactive oxygen species (ROS) via oral administration.
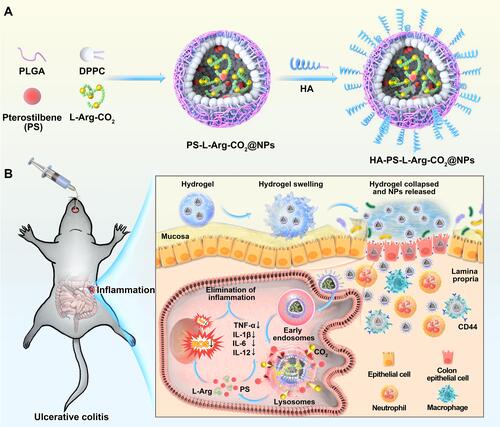
Figure 2 Synthesis and characterization of “nano-bomb effect” nanoparticles and hyaluronic acid (HA) modified with nanoparticles. (A) TEM images of the nanoparticles under different pH conditions for 3 h at 37°C (n=5). The nanoparticles maintain a spherical morphology and core-shell structure at pH 7.4, and were broken open under lower pH (pH 6.0 and pH 5.0), indicated the pH-activated behavior. (B) Size distribution of nanoparticles at different pH conditions were measured by dynamic light scattering (DLS) (n=5). (C) The zeta potential of nanoparticles was −17.4±6.82 mV, which was measured by dynamic light scattering (DLS) (n=5). (D) TEM images of L-Arg-CO2@NPs modified with HA. (E and F) Size distribution and zeta potential of L-Arg-CO2@NPs (NPs) and HA-L-Arg-CO2@NPs (HA NPs) were determined by dynamic light scattering (DLS). (G) FT-IR spectra of HA-L-Arg-CO2@NPs (HA NPs) showing the changes of infrared spectra of the Michael addition reaction between maleimide and sulfhydryl.
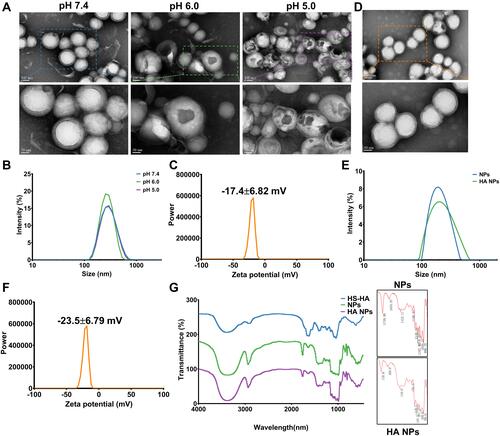
Figure 3 Cellular uptake of nanoparticles and low pH-activated lysosomal escape of HA-PS@NPs. (A) Colon-26 cells were incubated with DiL-labeled HA NPs, then stained by FITC-phalloidin and DAPI to visualize cytoskeleton and nucleus, respectively. (B) Raw 264.7 cells were incubated with DiL-labeled HA-NPs, then stained by FITC-phalloidin and DAPI to visualize cytoskeleton and nucleus, respectively. (C) Colon-26 cells uptake efficiency of NPs and HA NPs were measured using flow cytometry. (D) Raw 264.7 cells uptake efficiency of HA NPs were measured using flow cytometry. (E) Representative images of Colon-26 cells incubated with HA-PS@NPs with CO2 and HA-PS@NPs without CO2 for 1 h and 6 h at 37°C. The cell nuclei were stained by DAPI (blue), the lysosomes were stained by LysoTracker Red (red), and HA-PS@NPs were labeled with DiO (green). (F) Color scatter plots of HA-PS@NPs vs lysosomes. (G) Plot profiles of HA-PS@NPs vs lysosomes. (H–I) Corresponding Pearson’s correlation coefficient (PCC) values of HA-PS@NPs vs lysosomes (mean ± standard deviation, n > 10) at 1h and 6h. *P < 0.05, **P < 0.01 with 95% confidence level from the unpaired t-test.
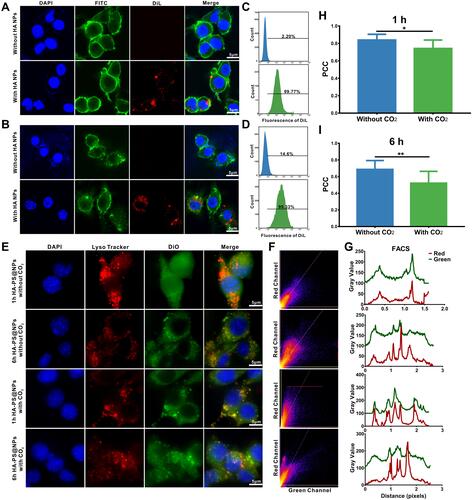
Figure 4 Synergistic effect of HA-PS@NPs to reduce LPS-induced macrophage inflammation. (A) ROS levels with different treatments were evaluated. ROS probe, DCFH-DA (10μM), was added to the cells and incubated for 30 min. Rosup (0.5mg/mL) treated group was a positive control. Fluorescence of cells was observed by fluorescence microscope with 488 nm excitation and 525nm emission. (B) The fluorescence intensity of each group was analyzed by Image J software, (n=6), **p<0.01. (C–E) mRNAs expression of TNF-α, IL-1β and IL-6 in Raw 264.7 cells with different treatments were evaluated by real-time PCR, (n=6), **p<0.01, ***p<0.01.
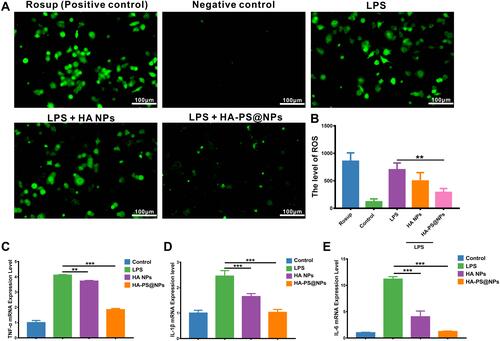
Figure 5 Biocompatibility evaluation of HA NPs in vitro and in vivo. (A) The counts’ changes of Red blood cell, White blood cell, Neutrophil, Lymphocyte Platelet, Hemoglobin, alanine aminotransferase (ALT), aspartate aminotransferase (AST), urea (UREA) and creatinine (CREA), creatine kinase (CK) and lactate dehydrogenase (LDH-1) (n=6). (B) H&E staining of vital organs (heart, liver, spleen, lung, kidney) was used to assess the systemic toxicity of HA NPs.
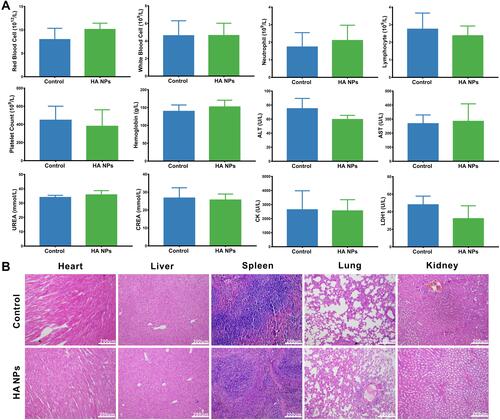
Figure 6 In vivo inflammation targeting of HA NPs in colitis mice. In vivo inflammation targeting of HA NPs in colitis mice. (A) DiR-labeled NPs and HA NPs were orally administrated to colitic mice and healthy controls. Images were obtained at 12 h post-administration using the VISQUE Invivo Smart-LF animal live imaging system. (B) Fluorescence intensities of the region of interest (ROI) were quantified with an imaging system (n=3), *p<0.05, **p<0.01.
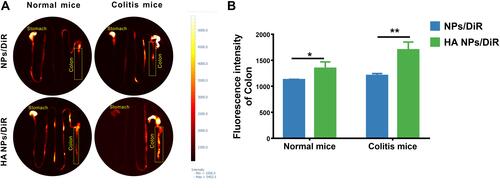
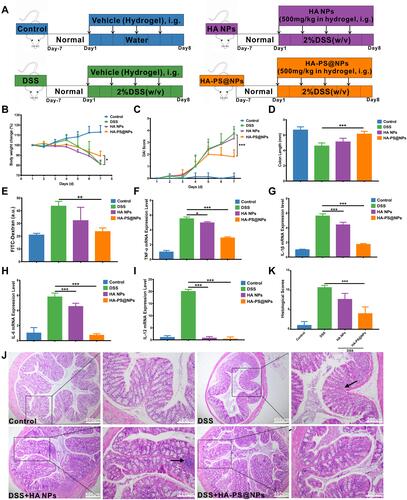
Figure 7 Oral administration of HA NPs and HA-PS@NPs yields an enhanced therapeutic efficacy against DSS-induced UC. (A) Schematic illustration of the murine model of colitis induced by 2% DSS along with NPs treatment at 500 mg/kg (PS 40mg/kg) for consecutive 7 days. Mice were orally administrated with hydrogel or hydrogel encapsulated of HA NPs and HA-PS@NPs every other day. The daily changes in body weight (n=6) (B) and disease activity index (DAI) (C) of the mice during a 7-day treatment course. (D) Colon length change of different treatment groups (n=6). (E) HA-PS@NPs significantly reduces epithelial permeability in UC. The mice were gavaged with FITC-dextran (40 mg/100 g body weight) and blood was collected 5 hours later. The serum concentration of FITC-dextran was quantified by a fluorescence Spectrometer (485/528 nm) (n=5), *p<0.05, **p<0.01, ***p<0.01. (F–I) The mRNA expression levels of TNF-α, IL-1β, IL-6, IL-12 (n=6). *p<0.05, ***p<0.01. (J) Hematoxylin and eosin staining for microscopic evaluation of the colon sections isolated from healthy control, DSS, HA NPs and HA-PS@NPs treated groups. Images of tissues are shown with 4× and 100× magnification, (n=10/group). Arrowheads indicate inflammatory cells in the lamina propria. (K) Histological scores from the different treatment groups were calculated (n=6). ***p<0.001.