Figures & data
Figure 1 UV-vis spectra of AuNCs, AuNCs-DAB and AuNCs-DAB-Lf.
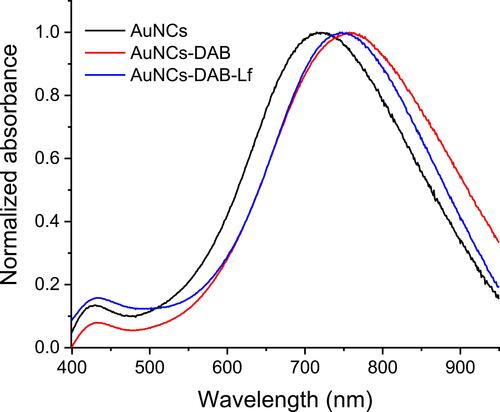
Figure 2 Gel retardation assay of AuNCs-DAB-Lf-DNA complex at various AuNCs-DAB-Lf: DNA weight ratios (0.5:1, 1:1, 5:1, 10:1, 20:1, 40:1) (control: DNA only).
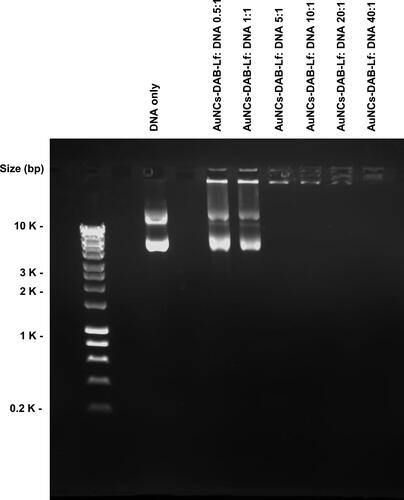
Figure 3 Size (A) and zeta potential (B) of AuNCs-DAB-Lf complexed with DNA at various AuNCs-DAB-Lf: DNA weight ratios. Results are expressed as mean ± SEM (n = 9) (error bars smaller than symbols).
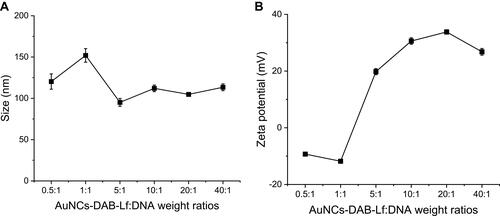
Figure 4 Transfection efficiency of AuNCs-DAB-Lf at various AuNCs-DAB-Lf: DNA weight ratios in PC-3 cells. Results are expressed as the mean ± SEM of three replicates (n=15). *P < 0.05 versus the highest transfection ratio.
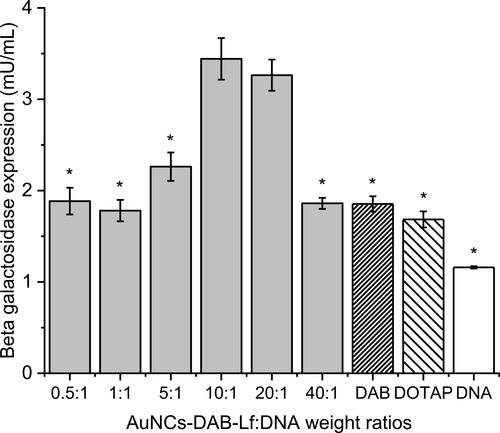
Figure 5 Quantification of the cellular uptake of fluorescein-labelled DNA complexed with AuNCs-DAB-Lf or left uncomplexed, after 24 h incubation with PC-3 cells, using flow cytometry (n = 6) (*P < 0.05 versus the highest fluorescence intensity).
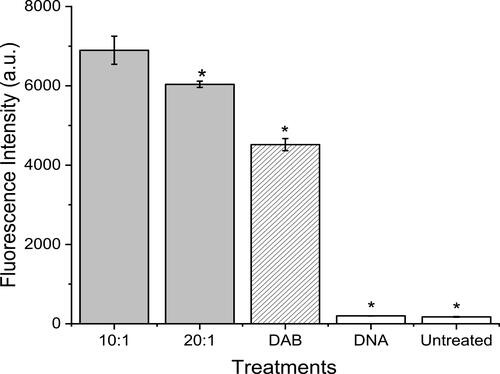
Figure 6 Confocal microscopy images of the cellular uptake of fluorescein-labelled DNA (2.5 μg per well), complexed with (A) AuNCs-DAB-Lf at weight ratio of 10:1, (B) DAB with weight ratio of 5:1, (C) free in solution after 24 h incubation with PC-3 cells ((D) untreated cells). Blue: nuclei stained with DAPI (excitation: 405 nm laser line; bandwidth: 415–491 nm), green: fluorescein-labelled DNA (excitation: 453 nm laser line; bandwidth: 550–620 nm) (magnification: ×63).
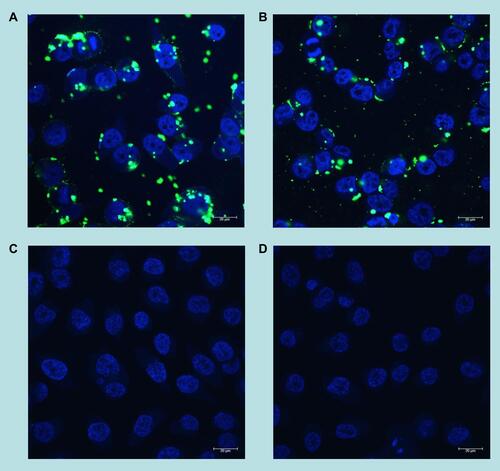
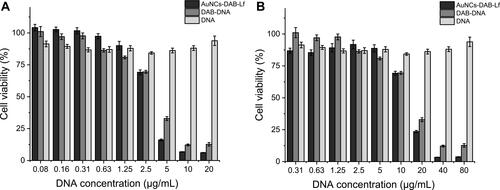
Figure 7 Anti-proliferative activity of AuNCs-DAB-Lf complexed with DNA-encoding TNFα at conjugate: DNA weight ratio of 40:1 (A) and 10:1 (B) in PC-3 cells (n = 15).