Figures & data
Figure 1 Influence of log(MChS/MCS) on the particle size and the zeta potential of FITC-BSA-loaded ChS-CS nanoparticles. (◆) Particle size, (■) zeta potential (A), particle size distribution of the formulation with a ChS/CS volume ratio of 2.8/4 (B) and 4/1 (C). Initial concentrations were ChS (4 mg/mL) and CS (4 mg/mL).
Abbreviations: BSA, bovine serum albumin; ChS, chondroitin 4-sulfate sodium salt; CS, chitosan; FITC, fluorescein isothiocyanate.
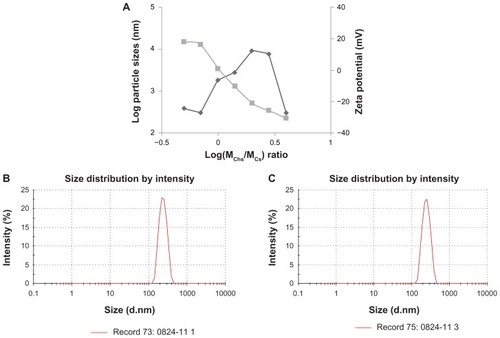
Figure 2 Images of FE-SEM (I) and TEM (II) micrographs of ChS-CS nanoparticles and FITC-BSA-loaded ChS-CS nanoparticles. (A) Blank ChS-CS nanoparticles (+). (B) FITC-BSA-loaded ChS-CS nanoparticles (+). (C) Blank ChS-CS nanoparticles (−). (D) FITC-BSA-loaded ChS-CS nanoparticles (−).
Note: Bar 100 nm.
Abbreviations: BSA, bovine serum albumin; ChS, chondroitin 4-sulfate sodium salt; CS, chitosan; FITC, fluorescein isothiocyanate; FE-SEM, field emission scanning electron microscopy; TEM, transmission electron microscopy.
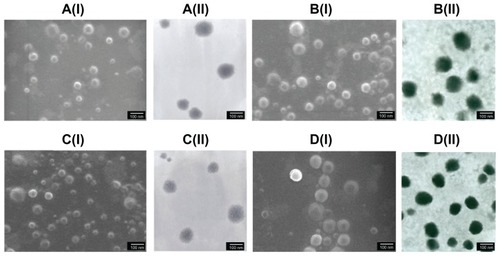
Figure 3 Cytotoxicity profile of positively (blue) and negatively (red) charged ChSCS nanoparticles, and of positively (green) and negatively (purple) charged FITC-BSA loaded ChS-CS nanoparticles after 72 hours of incubation with Caco-2 cells as determined by WST-1 assay.
Notes: Percent viability of fibroblasts is expressed relative to control cells (results are represented as the mean ± standard deviation, n = 6).
Abbreviations: BSA, bovine serum albumin; ChS, chondroitin 4-sulfate sodium salt; CS, chitosan; FITC, fluorescein isothiocyanate.
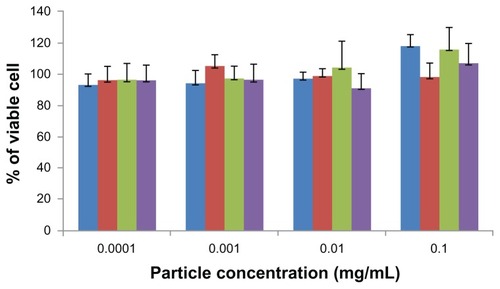
Figure 4 Uptake of positively charged nanoformulated FITC-BSA-loaded ChS-CS nanoparticles by Caco-2 cells following phagocyte cocultivation as described in the Methods section; confocal laser scanning imaging of Caco-2 incubated with FITC-BSA-loaded ChS-CS nanoparticles for 0, 1, 2, 4, and 6 hours (from top to bottom). (A) Cell nucleus stained with TO-PRO-3 iodide (blue part), (B) FITC-BSA-loaded ChS-CS nanoparticles (green part), (C) cell membranes stained with BoDiPY-phalloidin (red part), and (D) merged A, B, and C pictures.
Note: Bar 20 μm.
Abbreviations: BSA, bovine serum albumin; ChS, chondroitin 4-sulfate sodium salt; CS, chitosan; FITC, fluorescein isothiocyanate.
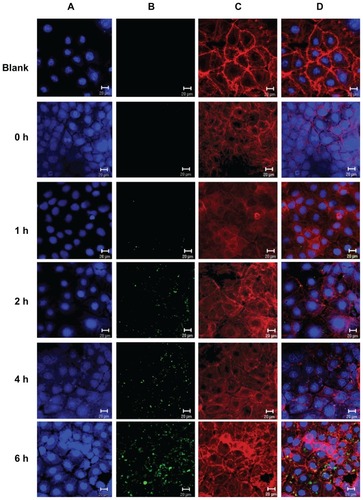
Figure 5 Time course for uptake of FITC-BSA-loaded ChS-CS nanoparticles by Caco-2 cells quantified by fluorescence-activated cell sorting analysis using flow cytometry at hours 0, 0.5, 1, 1.5, 2, 4, and 6.
Abbreviations: BSA, bovine serum albumin; ChS, chondroitin 4-sulfate sodium salt; CS, chitosan; FITC, fluorescein isothiocyanate.
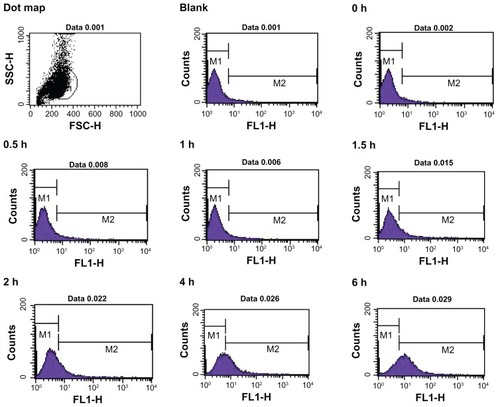
Figure 6 Fluorescent intensity according to flow cytometry data, elucidating the effect of charge modifications on the internalization efficiency of positively charged FITC-BSA-loaded ChS-CS nanoparticles (
 ), and FITC-BSA solution (0.1 mL; 0.1 mg/mL) (
 ) on Caco-2 cells at varied time incubations.
Note: Results are represented as the mean ± standard deviation, n = 6.
Abbreviations: BSA, bovine serum albumin; ChS, chondroitin 4-sulfate sodium salt; CS, chitosan; FITC, fluorescein isothiocyanate.
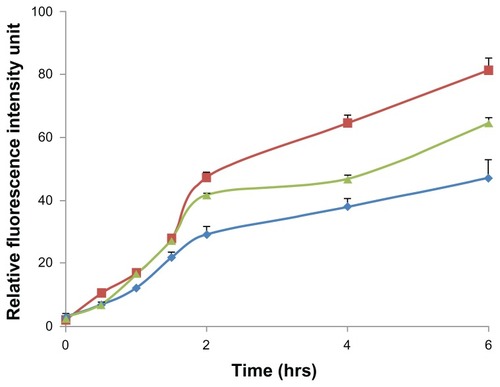
Figure 7 Confocal laser scanning imaging of Transwell membrane of Caco-2 incubated with positively charged FITC-BSA-loaded ChS-CS nanoparticles at 37°C for hours 0, 1, 2, 4, and 6 (from top to bottom) as described in the Methods section. (A) Cell nucleus stained with TO-PRO-3 iodide (blue part), (B) FITC-BSA-loaded ChS-CS nanoparticles (green part), (C) cell membrane stained with BoDiPY-phalloidin (red part), and (D) merged A, B, and C pictures.
Note: Scale bar 20 μm.
Abbreviations: BSA, bovine serum albumin; ChS, chondroitin 4-sulfate sodium salt; CS, chitosan; FITC, fluorescein isothiocyanate.
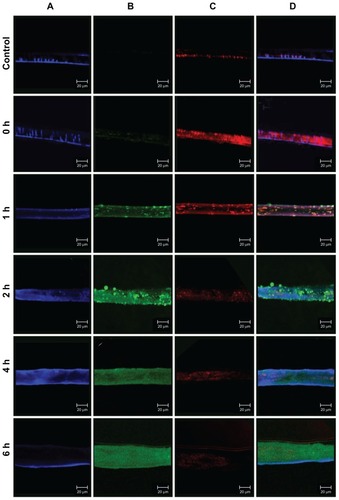
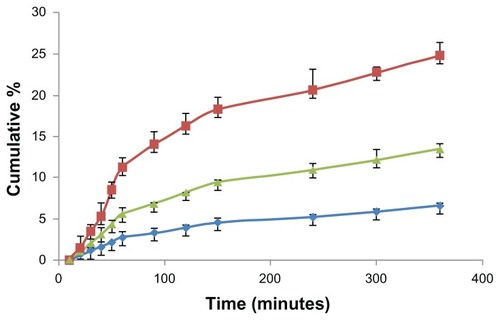
Figure 8 Time courses for the Caco-2 cell monolayer transepithelial transport efficiency study. The fluorescent intensity of FITC-BSA data; positive charge of FITC-BSA-loaded ChS-CS nanoparticles (
), and FITC-BSA solution (0.1 mL; 0.1 mg/mL) ().Notes: All values are shown as the mean ± standard deviation; n = 6.
Abbreviations: BSA, bovine serum albumin; ChS, chondroitin 4-sulfate sodium salt; CS, chitosan; FITC, fluorescein isothiocyanate.