Figures & data
Figure 1 Characterization of nanoparticles. (A) The hydrodynamic size and morphology of nanoparticles were characterized by DLS and TEM. (B) Colloidal stability of NPs was measured by DLS. (C) Radiostability of 125I-SN-38 was measured by TLC in 10% FBS at 37 °C. (D) Cumulative release of 125I-SN-38 at pH 5 and 7.4 at 37 °C over time. ***p < 0.001 were considered highly significant.
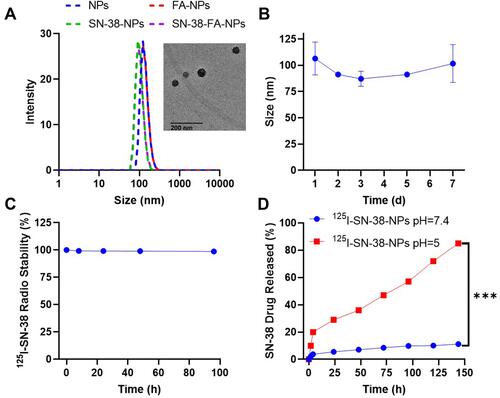
Figure 2 (A) Cell uptake of 125I-SN-38-NPs and 125I-SN-38-FA-NPs in MKN7 cells and 125I-SN-38-FA-NPs in NCI-N87 cells at concentrations varying from 35 to 560 μg/mL after 2 h incubation. (B) MTT assay of nanoparticles with concentrations varying from 12.5 to 100 µg/mL at 37 °C after 24 h incubation. **p < 0.01 and ***p < 0.001 were considered highly significant.
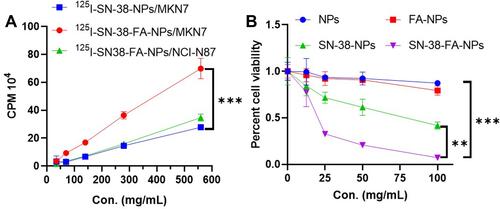
Figure 3 (A) Pharmacokinetics of 125I-SN-38-NPs and 125I-SN-38-FA-NPs (20 µCi) in healthy mice following intravenous injection (n=3). (B) Biodistribution of 125I-SN-38-NPs and 125I-SN-38-FA-NPs in MKN7 tumor-bearing mice after intravenous injection at 24 h (n=3). ***p < 0.001 were considered highly significant.
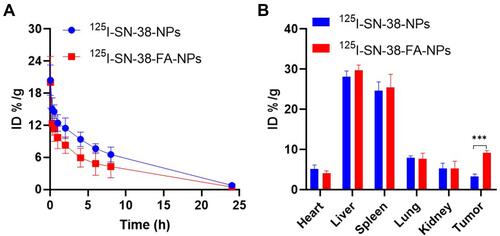
Figure 4 (A) microSPECT/CT images of 125I-SN-38-NPs and 125I-SN-38-FA-NPs in MKN7 tumor-bearing mice following intravenous injection. (B) SPECT images of tumor uptake over time. ***p < 0.001 were considered highly significant.
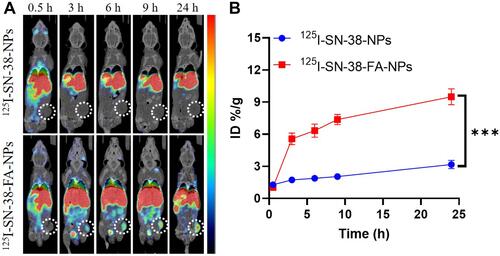
Figure 5 In vivo therapy. (A) Tumor growth rate. (B) Photograph of tumors after 40 days treatment. (C) Body weight changes in mice. (D) Microscopic images showing TUNNEL of tumors excised on Day 21. The scale bar corresponds to 50 μm. **p < 0.01 and ***p < 0.001 were considered highly significant.
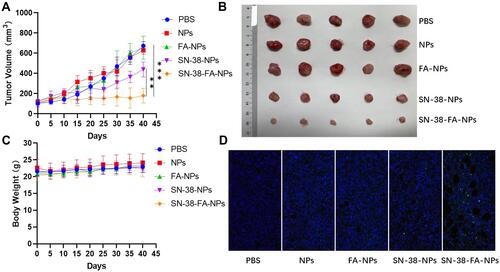
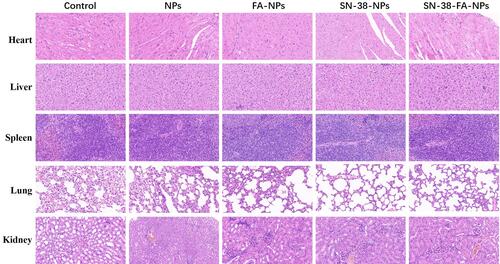
Figure 6 Microscopy images of H&E-stained major organs excised on Day 21. The scale bar corresponds to 50 μm.