Figures & data
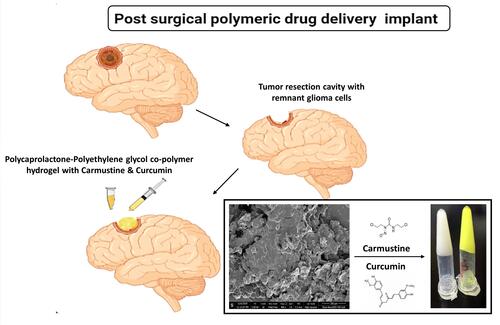
Figure 1 (A) Schematic representation of PCL-PEG co-polymer synthesis by polycondensation reaction of polycaprolactone diol and polyethylene glycol diacid. Characterization of co-polymer (B) FTIR spectrum of PCL diol, PEG diacid and PCL-PEG co-polymer with sharp peak at 1722 cm−1 representing ester bond. (C) H1 NMR spectrum of co-polymer. (D) DSC thermogram of PCL diol, PEG diacid and PCL-PEG co-polymer.
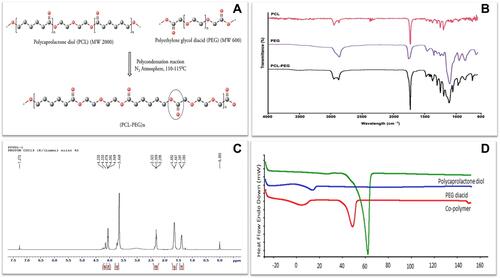
Figure 2 (A) 20% (w/v) PCL-PEG co-polymer forming hydrogel vs 20% (w/v) monomer PCL diol and PEG diacid blend, that does not form hydrogel. (B) Drug entrapped hydrogel holds its stable gel nature upon injection in excess PBS. (C) PCL-PEG hydrogel can be filled in syringes and ready for application for ease of administration. (D and E) Scanning electron micrograph of surface topology of PCL-PEG (400x) and 1000x, respectively. (F and G) 15,000x magnification of the surface shows layering of polymer in the gel and surface topography graph by Image J analysis of the same. (H) Rheology graph of amplitude sweep at 20°C , 37°C and 50°C with varying strain (0.001–100%). (I) Release study of carmustine and curcumin from the PCL-PEG hydrogel at 37°C in PBS for 360 h.
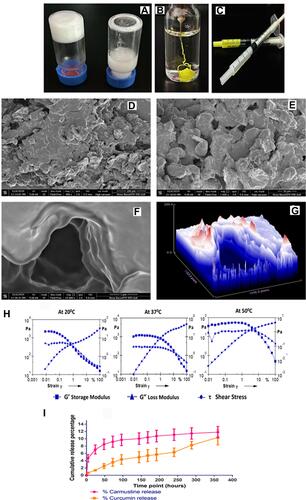
Figure 3 In silico modeling of two possible combination of PCL-PEG co-polymer chain PEG-PCL-PEG-PCL-PEG and PCL-PEG-PCL-PEG-PCL using Molecular Dynamics (MD) simulation. (A and C) Root means square deviation (RMSD) graph of total simulation time of 150 ns at 50°C, 20°C and 37°C for 50 ns each. (B and D) Representation of simulation of PCL-PEG molecules (ball chain) in cubic box with water molecules (mesh) at 50°C, 20°C, and 37°C (isolated final stable micelle formed from ~20 polymer molecules.
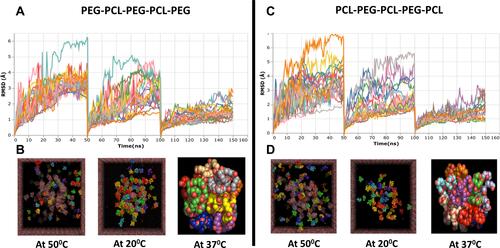
Figure 4 (A) Neuro-excitotoxicity study of PCL-PEG co-polymer enriched media (24–120 h) with glutamate (5 mM) as positive control analysed by MTT assay for viability post 24 h incubation (*P< 0.05, **P<0.01). In vivo biocompatibility study. (B) Rat brain(left), with implant in cortex (right) and site of implant of hydrogel 3 mm deep in cortex rat brain atlas (extreme right). (C) MRI scan at 3 mm depth PCL-PEG hydrogel implant at 1 week post-surgery and 12 weeks post-surgery (hydrogel intact in brain, swollen and partially degraded). (D) MRI scan of rat brain implanted with polymer (at 1 week and 12 weeks) and control animal with PBS implant (12 weeks). (E) Motor cortex function test comparison of rats with and without PCL-PEG implant hydrogel analysed by latency to fall and active movements before and after implant surgery (6 weeks post implant). (F) Immunofluorescence and hematoxylin and eosin staining of right hemisphere of rat brain cortex (control for inflammation caused due to surgical intervention in brain). (G) Immunostaining of rat brain tissues control and PCL-PEG implant at 1 week, 6 weeks and 12 weeks time point stained with Iba 1 antibody (green) GFAP antibody (red) and Hoechst (blue). IBA 1 positive cells are indicator of microglial activation as a part of inflammatory response. (H) Hematoxylin and eosin staining for histopathological analysis of rat brain tissues of control and PCL-PEG implanted animals at 1 week, 6 weeks and 12 weeks time point. Arrows indicate implant at the site of surgery.
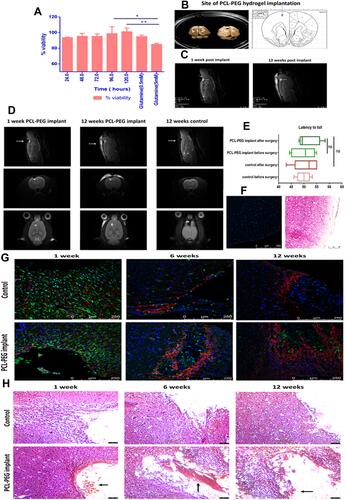
Figure 5 In vitro cytotoxicity analysis of (A) carmustine, (B) curcumin, (C) carmustine and curcumin combination on U251 glioma cells at the end of 72 h, cytotoxicity was assessed using MTT assay (n = 3). Based on Combination Index calculation carmustine and curcumin work synergistically. (D) Detection of caspase 3 cleavage by immunofluorescence. U251 glioma cells treated with carmustine (150 μM), Curcumin (20 μL) and combination of both for 48 h followed by staining with antibody against cleaved caspase 3 (Green- FITC) detected in cytoplasm, nucleus (Blue-Hoechst 33342). Combination Apoptotic index was significantly higher compared with individual carmustine (***P <0.0005) indicating positive impact of curcumin addition to increase cytotoxicity of carmustine. (E) Morphological changes in U251 cells treated with carmustine (150 μM), Curcumin (20 uM) and combination of both for 48 h (Brightfield image). (F) Cleavage of nuclear protein PARP, hallmark of apoptosis in U251 cells upon treatment with carmustine (150 μM), Curcumin (20μM) and combination of both for 48 h. Full length PARP (116 kDa), cleaved PARP (89 kDa) B actin (42 kDa).
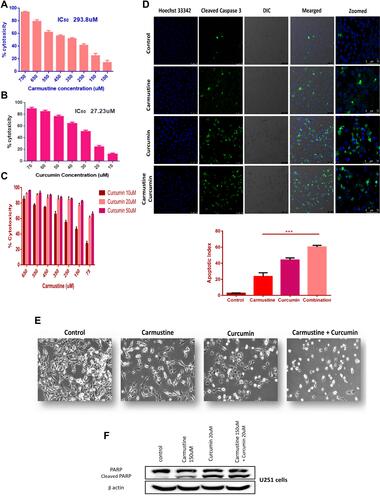
Figure 6 (A) Schematic representation of experimental set up to test in vitro efficacy of drug PCL-PEG hydrogel. (B) Calcein-AM and ethidium homodimer based Live dead analysis of U251 cells treated with carmustine and curcumin loaded PCL-PEG hydrogel for 24 h, 48 h, 72 h and PCL-PEG carrier alone as control. (C) Double stranded DNA breaks analysed by extent of incorporation of BrdU -TUNEL assay, in U251 cells treated with carmustine and curcumin loaded PCL-PEG hydrogel conditioned media. Increase in apoptosis with increase in time-dependent drug release.
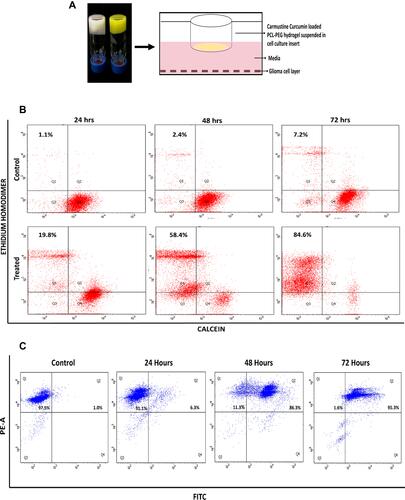
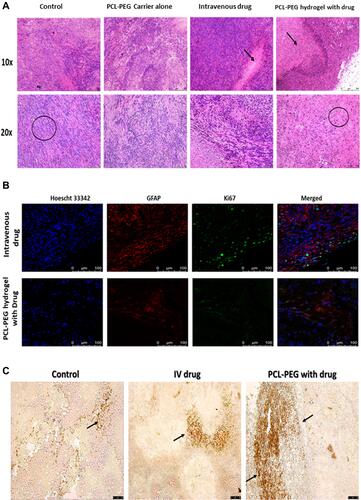
Figure 7 In vivo efficacy analysis of PCL-PEG carmustine and curcumin loaded hydrogel to inhibit aggressive tumor recurrence. (A) Schematic experimental representation of post-surgical treatment in xenograft glioma model in NOD-SCID mice. (B) Representative gradual luciferin bioluminescence based tumor volume monitoring post- surgery. (C) Tumor size at end point of study − 6 weeks post-surgical resection in control, PCL-PEG carrier, intravenous drug and PCL-PEG hydrogel with carmustine and curcumin. (D) Tumor volume progression after surgical resection up to 6 weeks of study (*P <0.05. ****P <0.0001). (E) Weight of animals through the post-surgery treatment period. (F) Kaplan−Meier Survival percent analysis for the 6 weeks post-surgery treatment period.
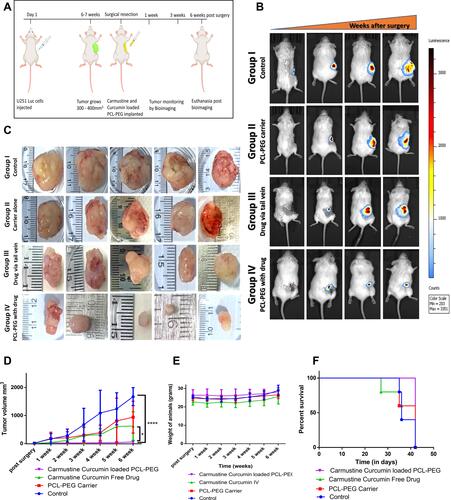
Figure 8 (A) Histopathological evaluation of paraffin-embedded tumor tissue by hematoxylin and eosin staining, after 6 weeks of treatment. (B) Confocal image-based evaluation by immunofluorescence of proliferation and prognostic marker Ki67 (Alexa 488), counter-stained with GFAP (eFluor 660) positive U251 cells to differentiate mice fibroblasts from human glioma cells and Hoechst 33342 to stain nucleus. (C) Brightfield image-based evaluation of tumor tissue sections stained with TUNEL assay, arrows indicate apoptotic cells with double stranded DNA breaks.