Figures & data
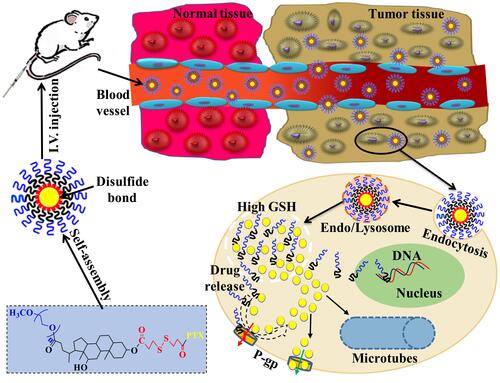
Scheme 1 The schematic diagram of the anti-tumor effect in vivo of PDSP micelles.
Scheme 2 The synthesized route of PDCP and PDSP polymer prodrugs.
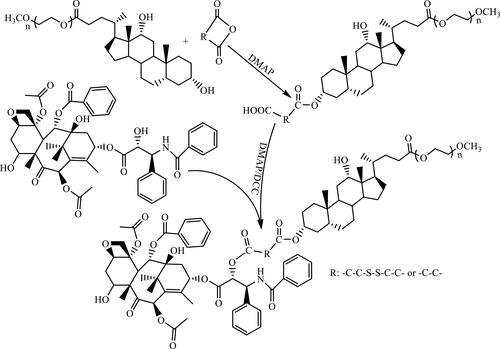
Table 1 The Factors and Levels of the Central Composite Design Test
Table 2 The Results of the Central Composite Design Test
Figure 1 The particle size and TEM photos of PDCP (A) and PDSP (B) micelles.
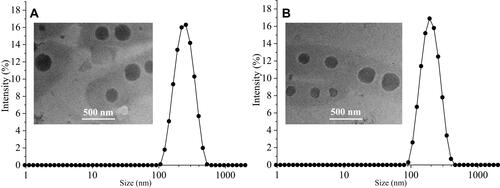
Figure 2 The results of in vitro stability and reduction-sensitivity test. (A) Dilution stability. (B) Storage stability. (C) Plasma stability. (D) Reduction-sensitive release in the environment with different levels of glutathione (GSH). (E) Reduction-sensitivity of mPEG-DCA-CC-PTX (PDCP) micelles. (F) Reduction-sensitivity of mPEG-DCA-SS-PTX (PDSP) micelles.
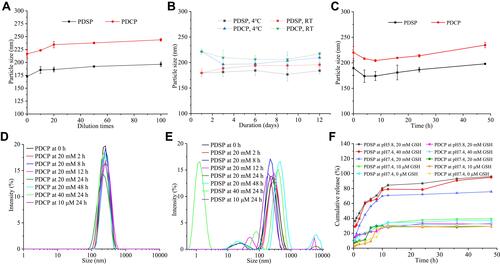
Figure 3 In vitro biosafety tests. (A) Hemolysis (i: Distilled water, ii: Saline, iii-v: mPEG-DCA-SS-PTX (PDSP) at 0.1, 0.3, 0.5 mg/mL, vi-viii: mPEG-DCA-CC-PTX (PDCP) at 0.1, 0.3, 0.5 mg/mL). (B) Hemolysis rate. (C) The cytotoxicity of blank micelle (BM) to HL-7702 cells. (D) The cytotoxicity of PDSP, PDCP, Paclitaxel (PTX) injection and PTX injection+BM to HL-7702 cells at 24 h. (E) The cytotoxicity of PDSP, PDCP, PTX injection and PTX injection+BM to HL-7702 cells at 48 h. Data were presented as mean ±SD. *P<0.05, **P<0.01.
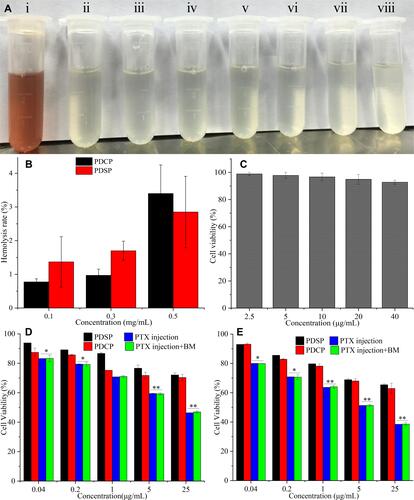
Figure 4 The cytotoxicity of six PTX formulations to SMCC-7721 cells (A and B), MCF-7 cells (C and D), and A549/PTX cells (E and F) at 24 h and 48 h. Data were presented as mean ±SD. The asterisk indicates the statistical significance between other formulations to Paclitaxel (PTX) injection, the rhombus indicates the statistical significance between mPEG-DCA-SS-PTX (PDSP) and PDSP+ glutathione (GSH). *P<0.05, **P<0.01, ***P<0.001, and ◊P<0.05, ◊◊P<0.01. BM, PDCP represents blank micelle and mPEG-DCA-CC-PTX, respectively.
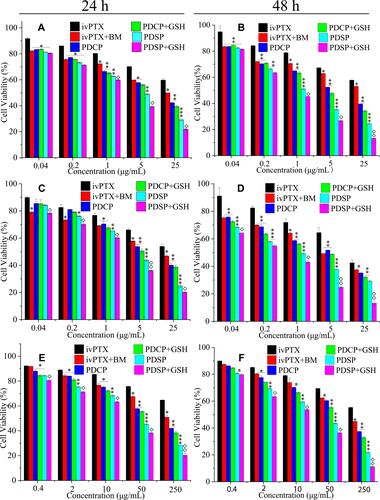
Figure 5 The results of in vivo anti-tumor activity of the different Paclitaxel (PTX) formulations (such as PTX injection, mPEG-DCA-CC-PTX (PDCP) and mPEG-DCA-SS-PTX (PDSP)) to H22 tumor in mice. (A) The change in tumor volume and the tumor shape (n=10), **P<0.01, ***P<0.001. (B) The inhibition rate of tumor volume, *P<0.05, ***P<0.001. (C) The change in the bodyweight of mice for 14 days. (D) The curve of mice survival for 14 days.
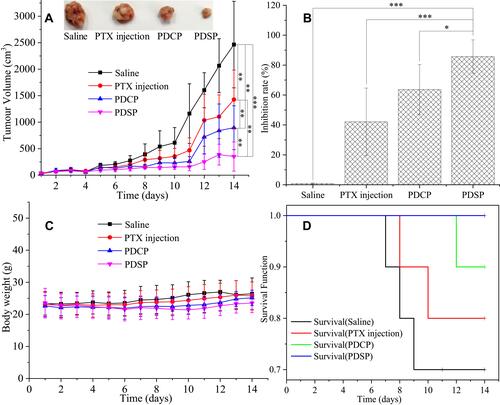
Figure 6 The images of the heart, liver, kidney, and tumor slices stained with H&E dyes after treatment by the different Paclitaxel (PTX) formulations, such as PTX injection, mPEG-DCA-CC-PTX (PDCP) and mPEG-DCA-SS-PTX (PDSP). Black arrows indicate tissue injury in this area, such as cell degeneration, necrosis, inflammatory cell infiltration and intra-tissue bleeding.
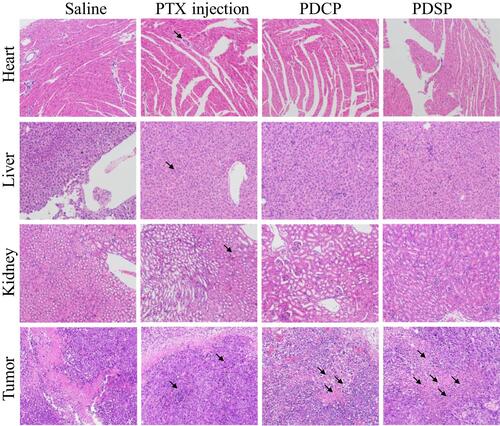
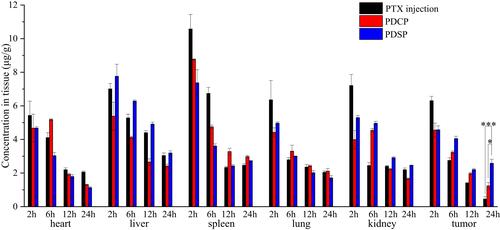
Figure 7 Body distribution of Paclitaxel (PTX) after i.v. administration of mPEG-DCA-CC-PTX (PDCP), mPEG-DCA-SS-PTX (PDSP) and PTX injection to mice at 2 h, 6 h, 12 h, 24 h (n=6), *P<0.05, ***P<0.001.