Figures & data
Scheme 1 Schematic illustration of mitochondria-targeted mesoporous titanium dioxide nanoparticles with L-arginine loading for synergistic nitric oxide gas-sonodynamic therapy.
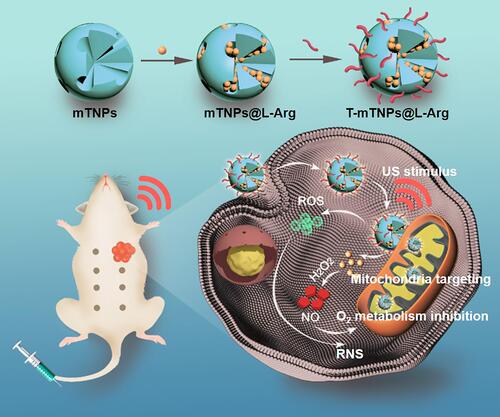
Figure 1 Characterization of T-mTNPs: (A) TEM images of mTNPs, scale bar=30 nm, (B) DLS analysis of mTNPs, (C) N2 adsorption/desorption isotherms of mTNPs, (D) Pore size distribution of mTNPs, (E) UV−vis absorption spectra, (F) L-Arg release profiles of T-mTNPs@L-Arg under different pH value, (G) Cumulative NO generation at different pH at the presence or absence of H2O2, (H) ROS generation detected by DPBF probe, (I) fluorescence spectrum of ONOO− detected by DHR probe.
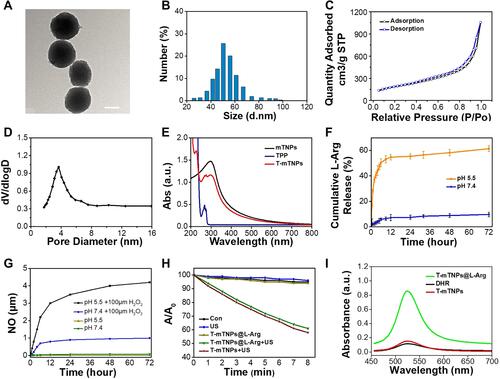
Figure 2 Mitochondria targeting and hypoxia relief: (A) Confocal microscope images of MCF-7 cells after incubated with FITC-labeled T-mTNPs@L-Arg and mTNPs@L-Arg and stained with Hoechst 33258 and MitoTracker, scale bar=10 nm (B) FITC fluorescence intensity of isolated mitochondria from MCF-7 cells after incubated with FITC-labeled T-mTNPs@L-Arg and mTNPs@L-Arg. The data are presented as the mean ± S.D. (n = 4). *p < 0.05 versus the mTNPs@L-Arg (C) Activity of Cco after various treatments. The data are presented as the mean ± S.D. (n = 4). *p < 0.05 versus the control groups, #p < 0.05 versus mTNPs@L-Arg. (D) Relative dissolved oxygen content in the cell medium of various groups. (E) Hypoxic status of MCF-7 cells detected by hypoxia red detection reagent l, scale bar=10 nm.
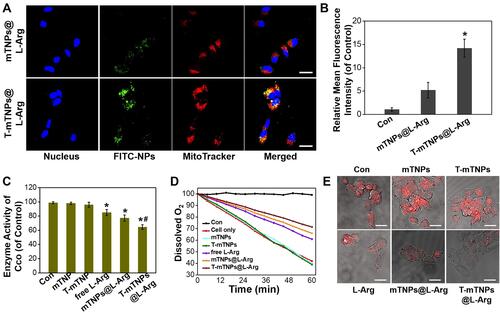
Figure 3 In Vitro SDT efficacy of T-mTNPs@L-Arg. (A) The destruction of mitochondria in MCF-7 cells after various treatments detected by CLSM, scale bar=10 nm. Cytotoxicity of different nanoparticles towards MCF-7 cells in the absence (B) or presence (C) of US stimulus. (D) Cell viability of hypoxic MCF-7 cells after treated with different nanoparticles in the presence of US. (E) CLSM images of MCF-7 cells stained with DCFH-DA in various groups, scale bar=10 nm. (F) ROS generation in various groups detected by FACS (“H” represents hypoxia). The data are presented as the mean ± S.D. (n = 4).
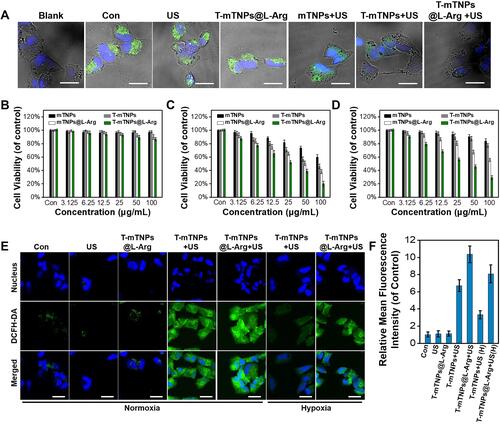
Figure 4 In Vivo SDT efficacy of T-mTNPs@L-Arg. (A) Biodistribution of T-mTNPs@L-Arg in MCF-7 tumor-bearing mice after intravenous injection at different time points. (B) Immunofluorescence images of tumors in various treatments on day 6. Tumor hypoxia was detected by Pimonidazole binding of HIF-1α antibody staining, scale bar=50 nm. (C) FACS assay of hypoxic area in tumor tissues. *p < 0.05 versus the control groups, #p < 0.05 versus mTNPs@L-Arg. (D) Tumor photographs. (E) Tumor volume. *p < 0.05 versus mTNPs@L-Arg. (F) Tumor weight. *p < 0.05 versus the control groups, #p < 0.05 versus mTNPs@L-Arg. All the data are presented as the mean ± S.D. (n = 4).
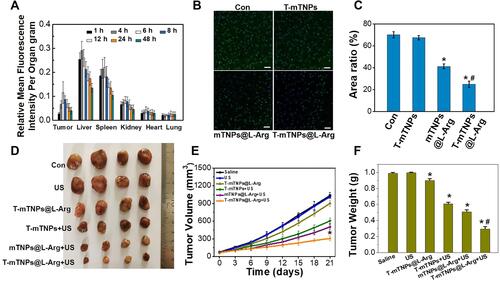
Figure 5 Evaluation of the systemic toxicity: (A) body weight. (B–E) blood biochemistry indicators include (B) alanine aminotransferase (ALT), (C) aspartate aminotransferase (AST), (D) blood urea nitrogen (BUN), and (E) creatinine (CRE). Data are presented as the mean ± S.D. (n = 4).
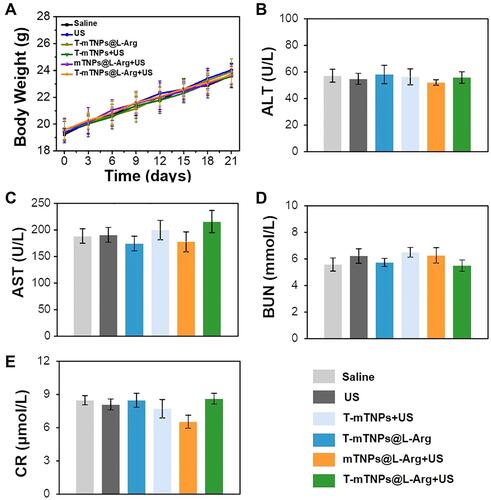
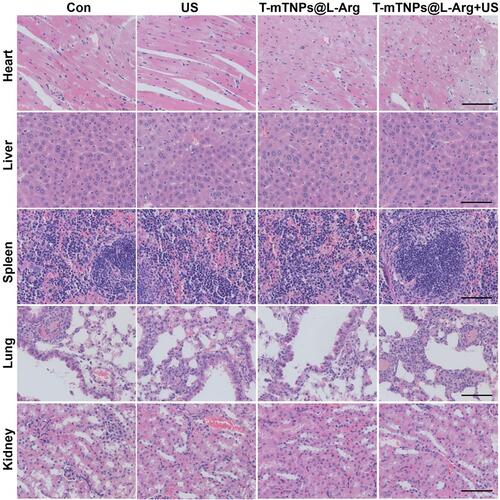
Figure 6 H&E staining images of the heart, liver, spleen, lung, and kidney from mice in various treatments, scale bar=100 nm.