Figures & data
Table 1 Effects of Different Preparation Methods on Particle Size and PDI of CS-NSP, n=3, mean ±SD
Figure 1 (A) Effect of stabilizer types, (B) Labrasol concentration, (C) glycerol monostearate concentration, (D) Labrafil M 1944 CS concentration (E) grinding time, and (F) dilution multiple on particle size and PDI of CS-NSP, respectively. n=3, mean ±SD.
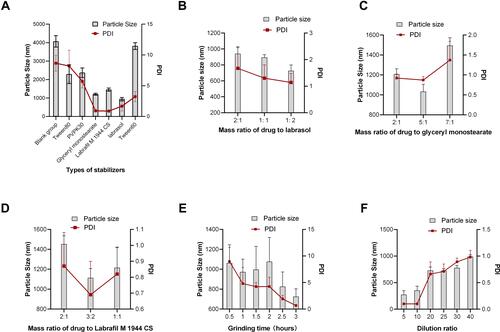
Table 2 Process Validation Results, n=3, mean ±SD
Table 3 Comparison of Viscosity and Content Determination Between CS-NSP and CS-INJ with the Same Concentration in the Market, n=3, mean ±SD
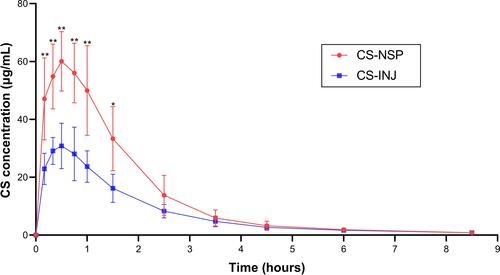
Table 4 Pharmacokinetic Parameters in Rats After Intramuscular Administration of CS-INJ and CS-NSP at a Dosage of 40 mg CS/kg Body Weight, n=5, mean ±SD
Figure 2 (A) Transmission electron microscopy of CS-NSP. (B) Appearance of CS-NSP and CS-INJ. (C) Particle size distribution of CS-NSP and (D) CS-INJ.
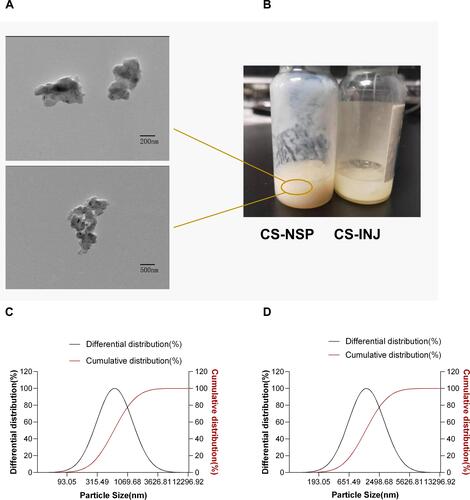
Figure 3 (A) Crystallize cefquinome sulfate in CS-NSP and CS-INJ to obtain solid powders and compare them with API for infrared analysis. (B) CS-NSP, CS-INJ and the physical mixture without bulk drug in liquid station for differential calorimetry and thermogravimetric analysis. (C) Crystallize cefquinome sulfate in CS-NSP and CS-INJ to obtain solid powders and compare them with API for X-ray diffraction.
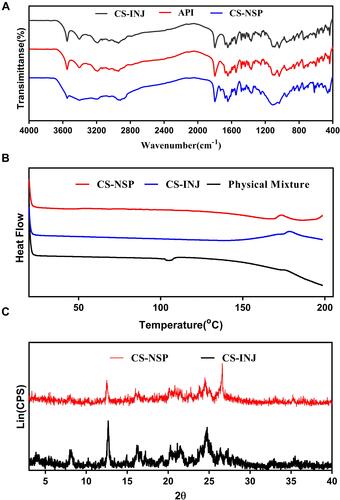
Figure 4 The comparison of cumulative release percentage profiles in CS-NSP and CS-INJ.
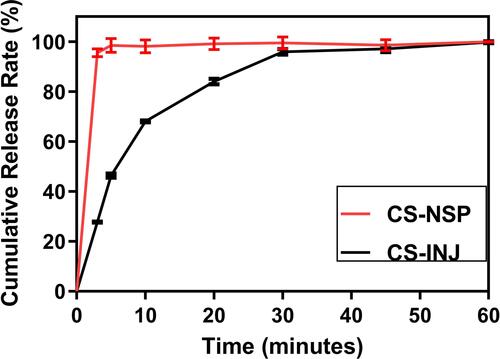
Figure 5 (A) Comparison of sedimentation volume ratio of CS-INJ and CS-NSP. (B) The change trend at illuminated light 4500 lx, (C) relative humidity 92%, and (D) temperature 60°C, on particle size and PDI of CS-NSP. (E) The change trend in Groups 1, 2, and 3 on content. (F) The change trend at illuminated light 4500 lx, (G) relative humidity 92%, and (H) temperature 60°C, on in cumulative release percentage profiles of CS-NSP, n=3, mean±SD.
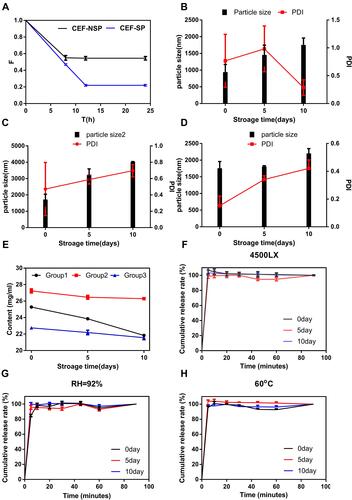
Figure 6 (A) Comparison of hemolysis rate of CS-NSP and CS-INJ. (B) Appearance of red blood cell suspension with (1–4) CS-NSP, (5–8) CS-INJ, (9) negative control, and (10) positive control after centrifugation, respectively.
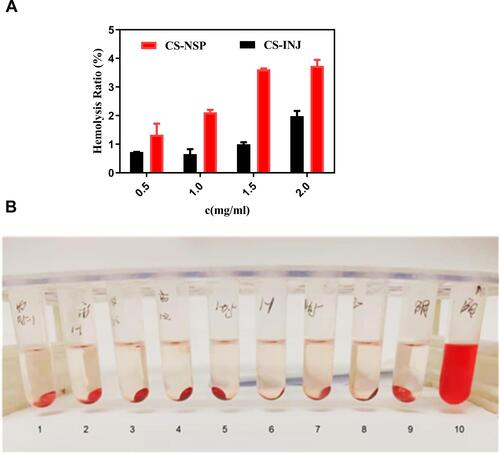
Figure 7 H&E staining image at the injection site of (1) normal saline group, (2) 0.2 mL Labrafac PG group, (3) 0.2 mL CS-NSP group, (4) 0.1 mL CS-NSP group, and (5) 0.2 mL CS-INJ, respectively.
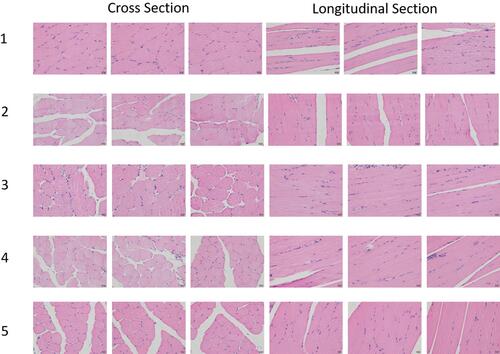
Figure 8 The mean plasma concentration – time profiles of CS-NSP and CS-INJ. Each rat was administrated at a dosage of 40 mg/kg body weight via intramuscular injection, and blood samples were collected at 0.17, 0.33, 0.50, 0.75, 1, 1.5, 2.5, 3.5, 4.5, 6, and 8.5 h, n=5, mean ±SD. *p<0.05, CS-NSP compared with CS-INJ; **p<0.01, CS-NSP compared with CS-INJ.