Figures & data
Figure 1 Characteristics of TPP. (A) SEM and TEM images of TPP. (B) Diameter and PDI of TPP. (C) Zeta potential of TPP. (D) PD-1 combination (DiI labeled PLGA-PEG, FITC labeled PD-1 antibody) was observed by fluorescence microscopy (× 400) and the binding efficiency was analyzed by FCM.
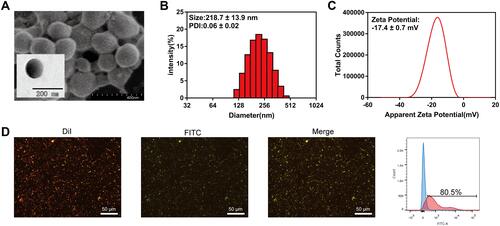
Figure 2 The stability and drug release of TPP. (A) Particle sizes and PDI of TPP on day 1, day 5, day 10. (B) Ultraviolet absorption spectrum of TPP, PLGA-PEG and TEPP-46. The absorption peaks of TPP and free TEPP-46 appeared at 272 nm and 305 nm. (C) Standard curve of TEPP-46 related to concentration and absorbance intensity. (D) Release pattern of TEPP-46 released from TPP within 96 h.
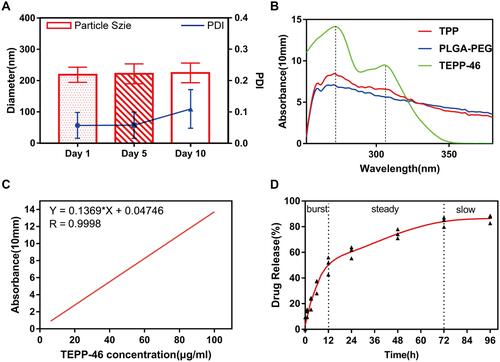
Table 1 Chemistry Analytes and Blood Counts of Mice
Figure 3 The compatibility of TPP with murine tissue. H&E staining (×200) of hearts, livers, spleens, lungs and kidneys of mice in control group and TPP group 7 days after treatment with PBS or TPP.
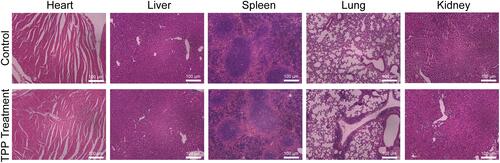
Figure 4 Targeting ability of TPP. (A) LSCM images of the combination of stimulated lymphocytes and TPP (targeted group) or TP (non-targeted group) (×400). The nucleus was stained blue by DAPI and TPP was stained red by DiI. (B) FCM analysis of the binding efficiency between stimulated lymphocytes and TPP (targeted group) or TP (non-targeted group). (****p<0.0001).
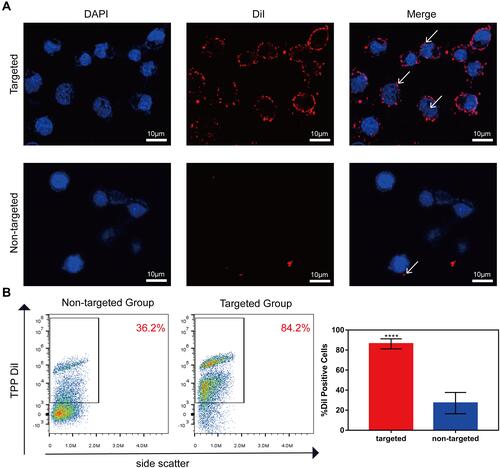
Figure 5 Suppressive effect of TPP on early activation and proliferation of stimulated lymphocytes. (A) The percentage of IL-2 producing cells in TPP group, mixture group and PBS group was detected by FCM. (B) The proliferation of lymphocytes in TPP group, mixture group and PBS group was detected by FCM using CelltraceViolet. (*p<0.05, **p<0.01,***p<0.001, ****p<0.0001).
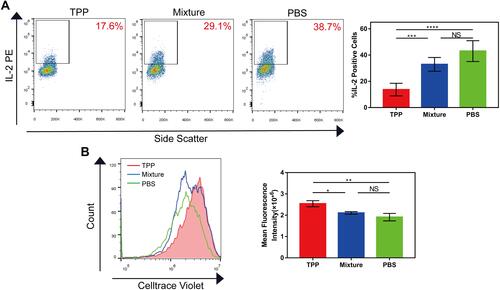
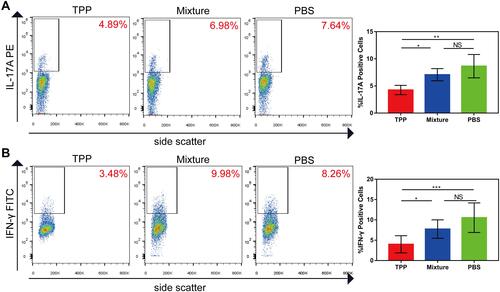
Figure 6 Inhibitory effect of TPP on Th1 and Th17 cells in vitro. (A) The percentage of IL-17 producing cells in TPP group, mixture group and PBS group was detected by FCM. (B) The percentage of IFN-γ producing cells in TPP group, mixture group and PBS group was detected by FCM. (*p<0.05, **p<0.01).
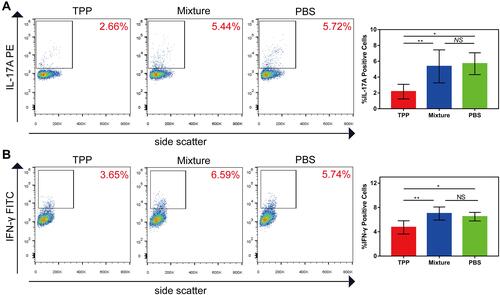
Figure 7 TPP alleviated the inflammatory activity of EAU. (A) Clinical analysis of mice in TPP group, mixture group and PBS group. (B) H&E staining (×100) of eyes for histopathological analysis of mice in TPP group, mixture group and PBS group. (*p<0.05, **p<0.01).
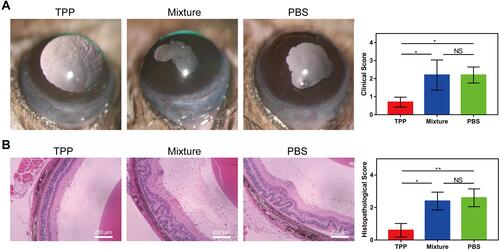
Figure 8 Inhibitory effect of TPP on Th1 and Th17 cells in vivo. (A) The percentage of IL-17 producing cells in TPP group, mixture group and PBS group was detected by FCM. (B) The percentage of IFN-γ producing cells in TPP group, mixture group and PBS group was detected by FCM. (*p<0.05, **p<0.01, ***p<0.001).