Figures & data
Figure 1 Schematic diagram of co-polymer self-assemble and micellar biodistribution.
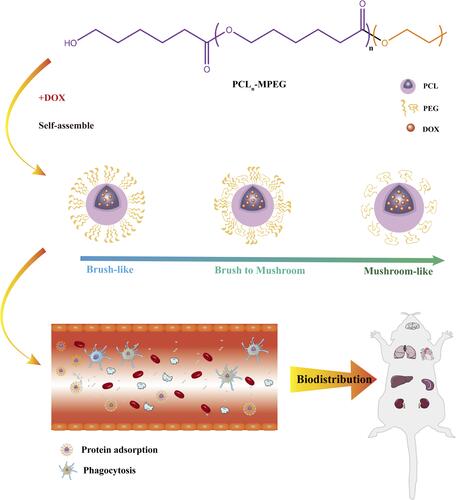
Figure 2 The 1H-NMR spectra of the copolymers.
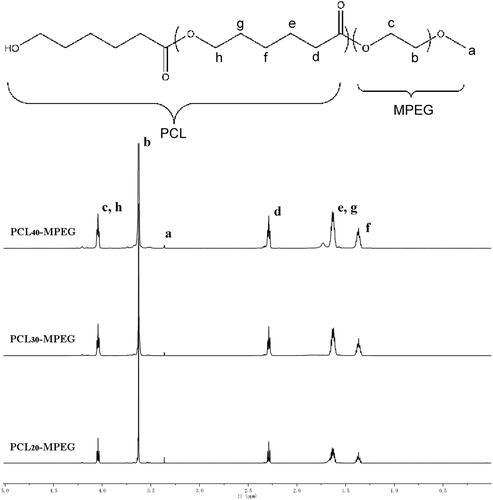
Table 1 The Characteristics of PCLn-MPEG Micelles
Figure 3 The TEM images of PCL20-MPEG (A), PCL30-MPEG (B), PCL40-MPEG (C) micelles, respectively. The scale bar is 100nm.
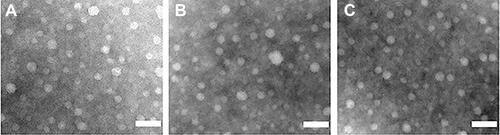
Figure 4 (A–C) The micellar self-assembled state at different simulation time and locally enlarged images of conformation. (D–F) The normalized RDF curves of the three micelles.
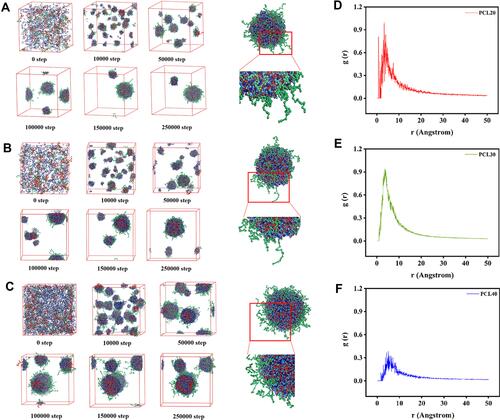
Figure 5 The images of the NTA for the micelles (the red florescence represent micelles). (A–C) Micelles before shear stress. (D–F) Micelles after shear stress. (G) The decrease in concentration of micelles after shear stress. (n=3, ***p <0.005, ****p <0.0001).
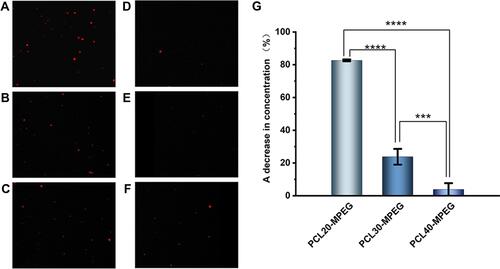
Figure 6 (A) The appearance of the micelles incubated with red blood cells suspension. (B) The hemolysis ratio of the micelles incubated with red blood cells suspension (n=3). (C) The images of the red blood cells aggregation induced by the micelles, NS, and Positive (PEI). The scale bar is 50um.
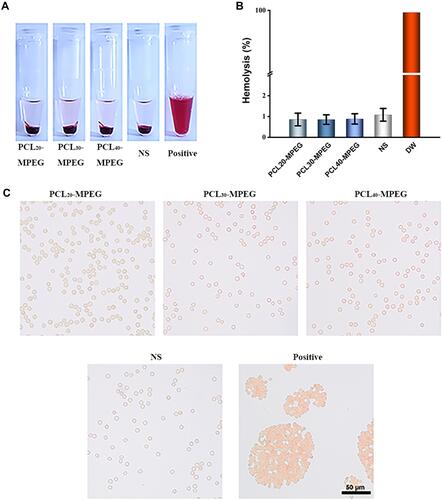
Figure 7 The effects of the micelles on blood coagulation. (A) APTT (B) TT (C) PT and (D) Fibrinogen. (n=3).
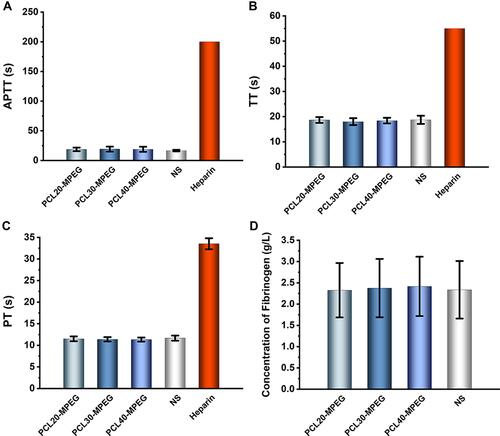
Figure 8 The effects of micelles on platelet activation. (A) Flow cytometry analysis of platelet activation. (B) The percentages of CD-62P that represent platelet activation. The PRP was incubated with micelles and controls. The expression of CD62p was determined using anti-CD62p antibody (n=3).
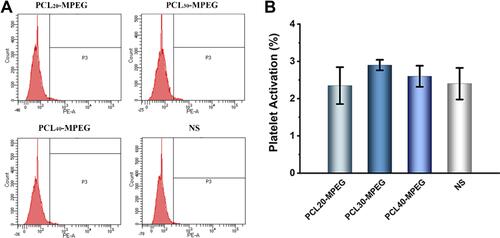
Figure 9 The amount of protein adsorption on the micelles. (A) BSA adsorption. (B) Fibrinogen adsorption. (C) Human plasma protein adsorption. (n=3, ***p<0.005, ****p <0.0001).
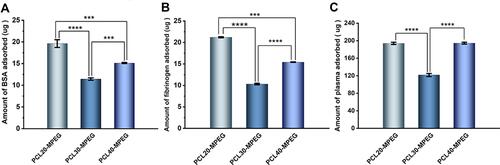
Figure 10 (A) The confocal images of the phagocytosis of the micelles by RAW264.7. The scale bar is 20um. (B and C) The flow cytometry results of the phagocytosis of the micelles by RAW264.7. (D) The quantification of the phagocytosis of micelles by mean fluorescence intensity (MFI). (n=3, ***p <0.005).
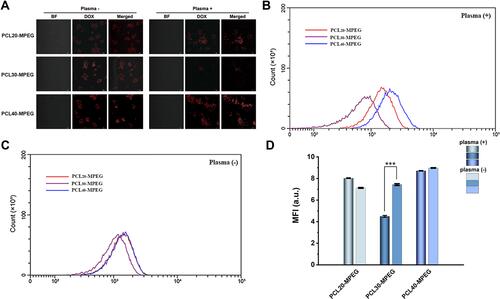
Figure 11 (A) The schematic illustration of the experimental schedule. The images of the PCLn-MPEG micelles biodistribution after injected into blood 1h (B) and 24h (C). The fluorescence intensities of the micelles biodistribution 1h (D) and 24h (E). (n=3, *p <0.05, **p <0.01, ***p <0.005, ****p <0.0001).
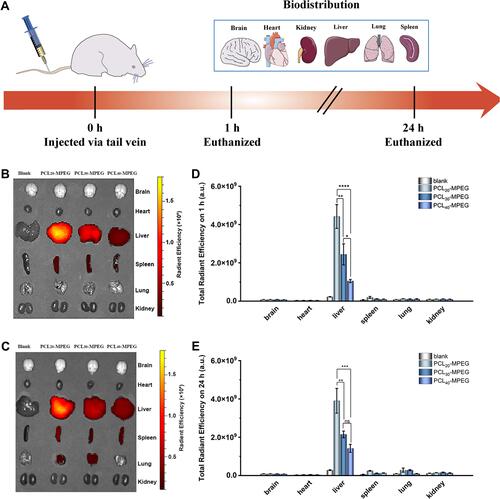
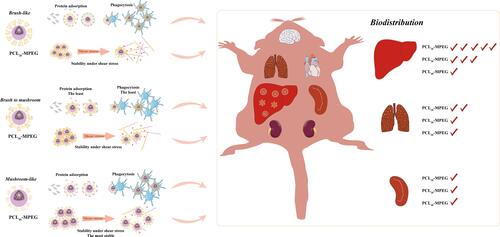
Figure 12 The schematic illustration of the proposed mechanism.