Figures & data
Scheme 1 CS-CDs, CMCS-CDs and QCS-CDs were prepared from CS, CMCS and QCS, respectively.
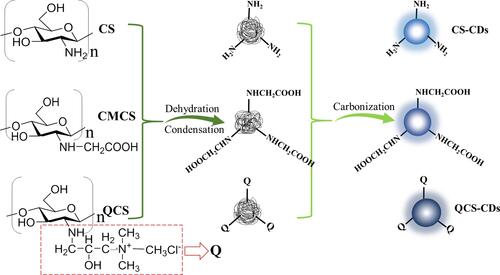
Table 1 The Emission Wavelength and Minimum Inhibitory Concentration (MIC) Against S. Aureus of CDs Prepared from Different Raw Materials
Figure 1 (A) The UV-Vis absorption and fluorescence spectrum for QCS-CA-CDs. Insets: QCS-CA-CDs solutions in daylight (left) and 365 nm UV lamp (right). (B) The UV-Vis absorption and fluorescence spectrum of QCS-EDA-CDs. Insets: QCS-EDA-CDs solutions in daylight (left) and 365 nm UV lamp (right). (C) FTIR spectra of QCS-CDs, QCS-CA-CDs and QCS-EDA-CDs. (D) zeta potential curves obtained for water suspensions of QCS-CA-CDs and QCS-EDA-CDs.
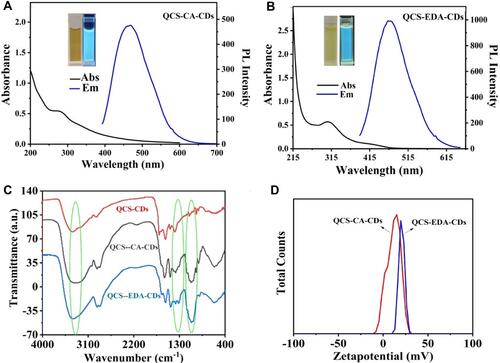
Figure 2 (A) Emission spectra of QCS-EDA-CDs with different excitation wavelengths. (B) TEM image of QCS-EDA-CDs. (C). Size distribution histogram of QCS-EDA-CDs. High-resolution XPS spectra (D) C1s, (E) O1s, and (F) N1s of QCS-EDA-CDs.
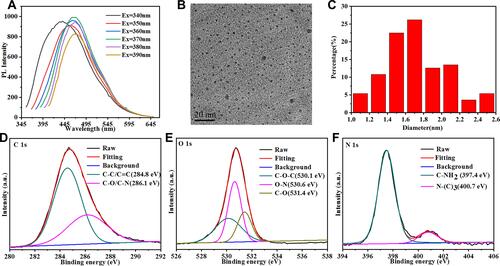
Table 2 Antibacterial Activities of QCS-CDs Were Compared with Various Chemically Prepared NPs and CDs
Figure 3 Inhibition effect of different QCS-EDA-CDs concentrations on S. aureus growth as a function of incubation time.
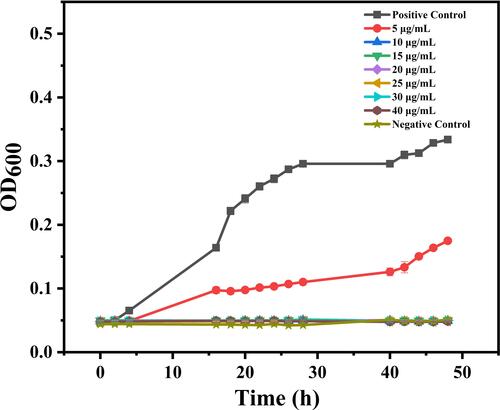
Table 3 Anti-Bacterial Biofilm Activities of Different Nanoparticles
Figure 4 Fluorescence microscopy images for S. aureus biofilms stained by (A-C) 250 μg/mL and (D-F) 500 μg/mL QCS-EDA-CDs for 2.5 h.
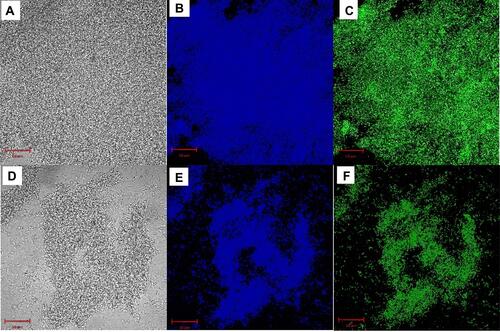
Figure 5 Confocal fluorescence image for S. aureus biofilm dyed in PI/DAPI exhibiting the existence of live bacteria (blue) and dead bacteria (red) upon treatment using (A-C) PBS, (D-F) 250 μg/mL QCS-EDA-CDs and (G-I) 500 μg/mL QCS-EDA-CDs for 2.5 h.
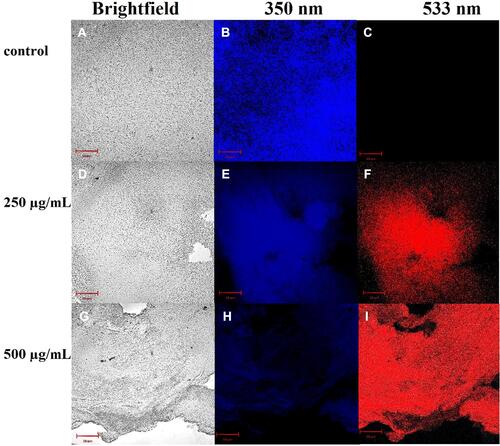
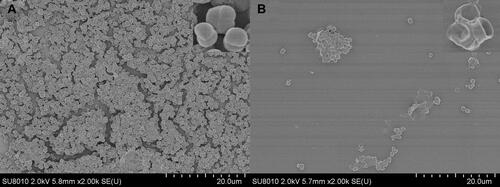
Figure 6 SEM images of S. aureus biofilm incubated for 4 h upon treatment of (A) PBS and (B) QCS-EDA-CDs (800 μg/mL), respectively.
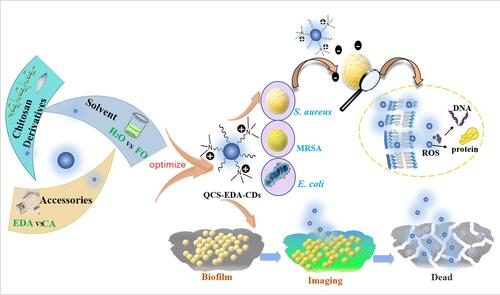
Scheme 2 Schematic diagram exhibiting QCS-EDA-CDs’ attack against S. aureus. QCS-EDA-CDs attach to the cell membrane by charge interactions, thus piercing cell membrane and damaging the DNA and protein of bacterial cells.
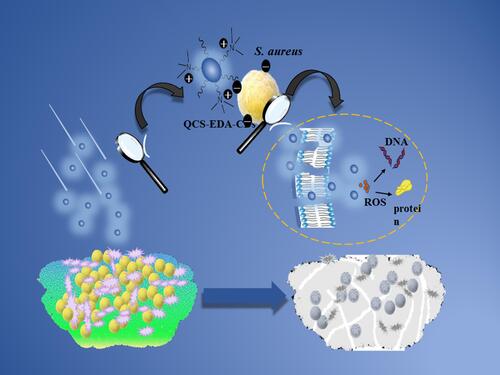
Figure 7 (A) Circular dichroism spectra for DNA with and without QCS-EDA-CDs treatment. (B) Circular dichroism spectra for S. aureus protein with and without QCS-EDA-CDs.
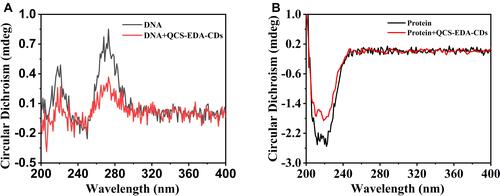
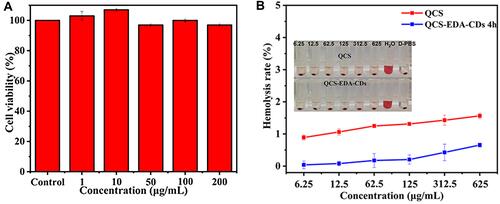
Figure 8 (A) Cell viability in LO2 cells at different QCS-EDA-CDs concentrations with DMSO as the positive control. (B) Hemolysis rate of QCS-EDA-CDs at different concentrations. Data are mean (SD ± n = 3).