Figures & data
Figure 1 Chemical structure of GA and schematic of OMV coating on GA nanoparticles.
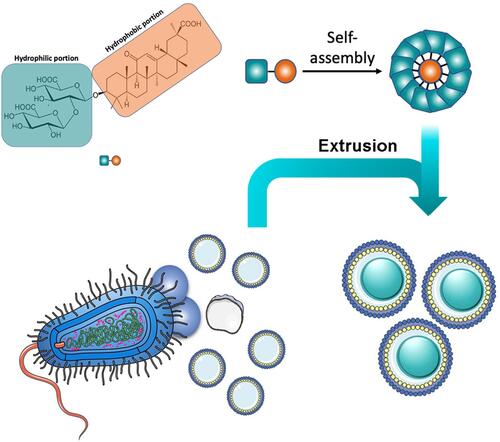
Figure 2 Characterization of OMV, GAN, and GAN-OMV. (A) TEM image; (B) Zeta potential; (C) Size distribution; (D) PDI value of OMV, GAN, and GAN-OMV; (E) Stability of GAN-OMV. (Bar=200 nm, **P<0.01, ***P<0.001, ****P <0.00001).
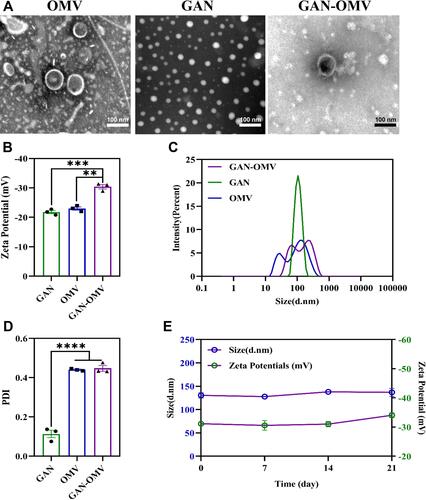
Figure 3 Cell viability of RAW264.7 cells in the stimulation of GAN-OMV, OMV, and GAN at 450nm (A). LPS was the positive control, and the BC was the negative control. The effects of GAN-OMV on the secretion of IL-1β, TNF-α, IL-6, and IL-10 (B–E). (*P<0.05, **P<0.01, ***P<0.001).
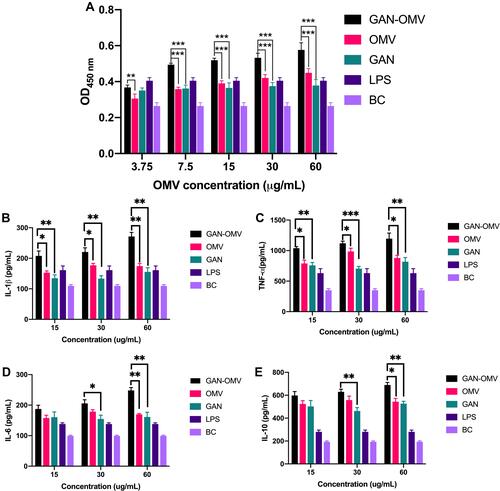
Figure 4 Effect of GAN-OMV on the macrophage polarization. (A) Flow cytometry of BMDMs stimulated with GAN-OMV, OMV, LPS/IFN-γ (M1), or IL-4/10 (M2). CD11b+ populations are marked within rectangles. Then CD80+CD206− and CD80−CD206+ populations were gated. (B) Quantitative analysis of the ratio of CD80+/CD206+. Statistical analysis was performed with one-way ANOVA. *P<0.05.
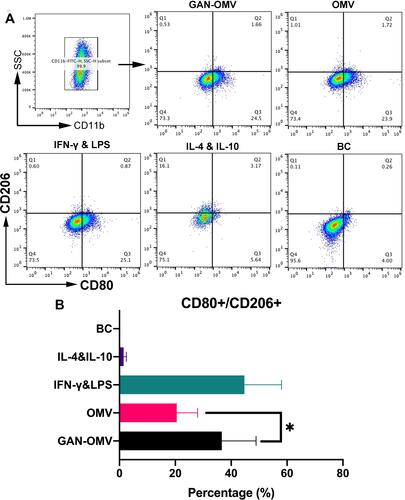
Figure 5 GAN-OMV internalized macrophages via different endocytic pathways. (A) RAW264.7 cells were pretreated with chlorpromazine (an endocytotic inhibitor of clathrin-mediated endocytosis), cytochalasin D (an endocytotic inhibitor of macropinocytosis-mediated endocytosis) or fillipin (an inhibitor of caveolae-mediated endocytosis). The intracellular uptake of GAN-OMV was investigated under confocal microscopy. (B) Changes of cell viability of RAW264.7 cells by cytochalasin D, chlorpromazine, and filipin were measured by CCK-8 method. **P < 0.01, ***P < 0.001. (C) Intracellular distribution of GAN-OMV was observed under confocal microscopy.
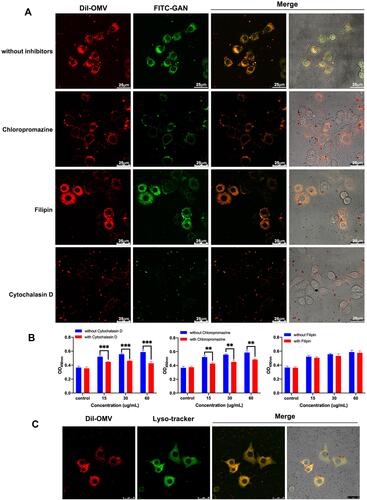
Figure 6 Antigen-specific antibodies produced by GAN-OMV-immunized mice. Mice (n=6) received either GAN-OMV, alum-OMV, OMV, or PBS (BC) in three doses in 7-day interval. Serum was collected 4 weeks after the last immunization. (A) OMV-specific and (B) Bb-specific IgG, IgG1, and IgG2a were analyzed by ELISA. *P<0.05, **P<0.01, ***P<0.001, ****P<0.0001.
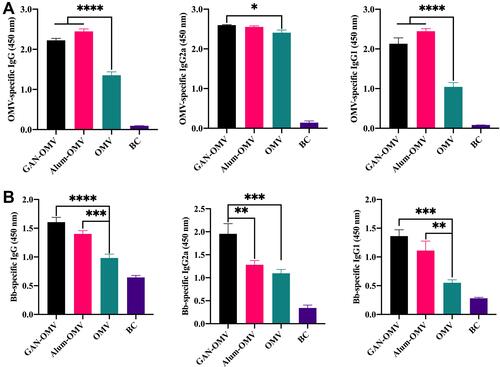
Figure 7 Splenocyte proliferation and differentiation of GAN-OMV-immunized mice. Mice (n=6) received either GAN-OMV, alum-OMV, OMV, or PBS (BC) in three doses in a 7-days interval. Splenocytes were collected after 4 weeks and stimulated with either LPS, ConA, or OMV. (A) The proliferation of LPS/ConA/OMV-stimulated lymphocytes from the spleen of immunized mice was measured by CCK-8 assay. (B) The quantitative data of (B) CD4+/CD8+ and (C) CD19+ splenocytes. Following CD3+ splenocyte gating, (D) CD4+ or CD8+ cells were analyzed. (E) CD19+ splenocytes were also analyzed by flow cytometry. *P<0.05, **P<0.01, ***P<0.001.
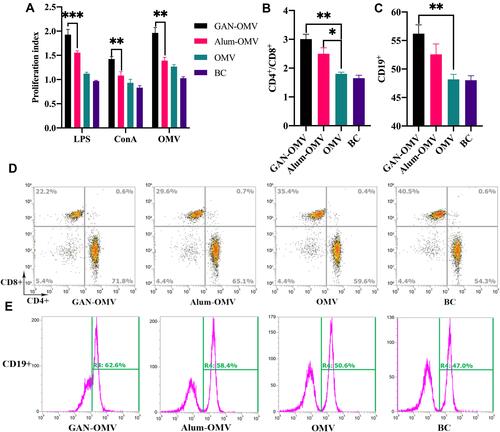
Figure 8 Cytokine production by splenocytes and in the serum of immunized mice. (A) Splenocytes were collected from immunized mice, and ELISA analyzed the Th1/Th2/Th17 cytokine production in the cell culture supernatant. (B) IFN-γ and IL-4 production in the serum of immunized mice was measured by ELISA. The data are reported as mean±SE (n=6). A statistically significant difference was determined between the groups by one-way ANOVA. *P<0.05; **P<0.01; ***P<0.001.
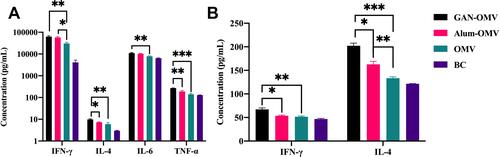
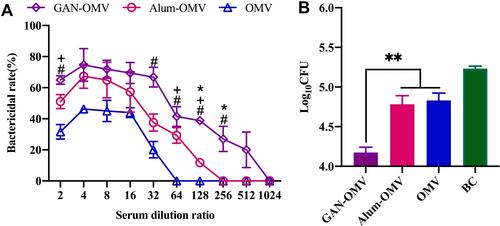
Figure 9 Reinfection prevention efficacy of GAN-OMV. Four weeks after the last vaccination, the serum of the immunized mice was collected, and the mice were subjected to Bb challenge (6.5×10⁶ CFU/mouse). (A) Bactericidal activity of the serum collected from immunized mice. (B) Number of Bb bacteria colonized in the lungs of immunized and naïve mice. *P<0.05; **P<0.01 for GAN-OMV vs alum-OMV. #P<0.05 for GAN-OMV vs OMV group. +P<0.05 for alum-OMV vs OMV group.