
Figures & data
Figure 1 Identification of cells and sEV. (A a and B a) DFSCs and PDLSCs morphology under an optical microscope. Scale bar: 200 μm. (A b and B b) Representative pictures after osteogenesis induction for 2 weeks. Scale bar:100 μm. (A c and B c) Representative pictures after adipogenesis induction for 2 weeks. Scale bar:100μm. (C) Flow cytometry detection of the cell markers CD90, CD73, CD31, and CD34 in DFSCs. (D) Flow cytometry detection of the cell markers CD90, CD73, CD31, and CD34 in PDLSCs. (E) TEM analysis was performed and verified that D-sEV and L-D-sEV were double-membrane shapes with diameters between 30 and 150 nm. Scale bar: 200 nm. (F) Size distribution of D-sEV and L-D-sEV as determined by NTA. (G) Western blot for Hsp70, Tsg101, CD63, and GAPDH in DFSCs, D-sEV, and L-D-sEV.
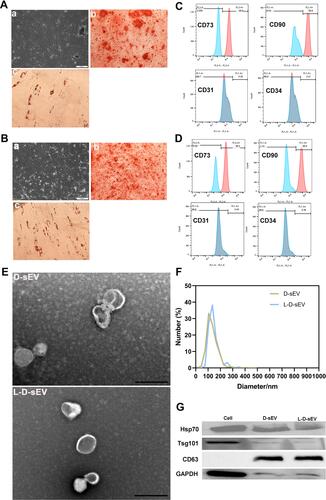
Table 1 List of the Up-Regulated Proteins in L-D-sEV vs D-sEV
Table 2 List of the Down-Regulated Proteins in L-D-sEV vs D-sEV
Table 3 List of the Detected or Undetected Proteins in L-D-sEV vs D-sEV
Figure 2 Quantitative proteomic analysis of D-sEV and L-D-sEV. (A) Gene ontology (GO) analysis of the DEPs in L-D-sEV vs D-sEV. The right coordinate axis indicates the number of proteins for each GO annotation, and the lower coordinate axis indicates the GO annotations. Blue stripes indicate biological process categories of DEPs; red stripes indicate categories of molecular functions; yellow stripes indicate categories of cellular components. (B) PPI analysis of some DEPs related to antioxidant activity. (C) KEGG annotation analysis of DEPs in L-D-sEV vs D-sEV.
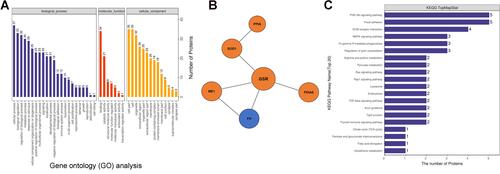
Figure 3 L-D-sEV inhibited the RANKL/OPG ratio in PDLSCs via ROS/JNK signaling under inflammatory conditions. (A) PDLSCs were cocultured with (100 μg/mL) D-sEV or L-D-sEV, and cell viability was measured by CCK-8 assay. (B) Representative images of the cell migration assay and quantitative analysis. Scale bar: 200 μm. (C) Intracellular ROS levels were measured by flow cytometry. PDLSCs were pretreated with LPS (1 μg/mL, 24 h) and then cocultured with D-sEV or L-D-sEV (100 μg/mL, 4 h or 8 h). (D) Quantitative analysis of intracellular ROS levels. (E) The JNK, p-JNK, ERK, p-ERK, OPG and RANKL protein levels were measured by Western blot. PDLSCs were cocultured with D-sEV or L-D-sEV (100 µg/mL, 48 h). (F) Quantitative analysis of the protein bands in . (G) The JNK, p-JNK, ERK, p-ERK, OPG and RANKL protein levels were measured by Western blot. PDLSCs were stimulated with LPS (1 µg/mL, 24 h) and then cocultured with D-sEV or L-D-sEV (100 µg/mL, 48 h). (H) Quantitative analysis of the protein bands in . (I) The OPG, RANKL, JNK, and p-JNK protein levels were measured by Western blot and quantitative analysis. PDLSCs were incubated with LPS (1 μg/mL, 24 h) and then stimulated with SP600125 (5 µM, 10 µM) for 24 h. (J) DFSC-sEV inhibited the RANKL/OPG ratio via ROS/JNK signaling. Data are shown as the mean ± SEM for three independent experiments. *P < 0.05; **P < 0.01; ***P < 0.001.
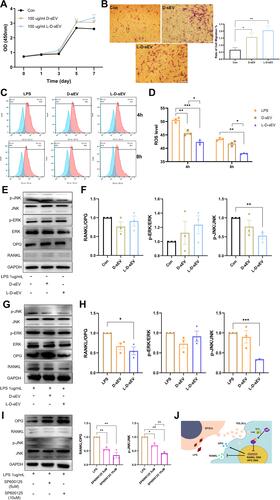
Figure 4 L-D-sEV promoted macrophage proliferation and M2 polarization. (A) Uptake analysis of D-sEV and L-D-sEV by RAW264.7 cells (red: phalloidin, green: DiO-labeled sEV, blue: DAPI-labeled nuclei). Scale bar: 10 μm. (B) RAW264.7 cells were cocultured with (20, 50, or 100 μg/mL) D-sEV or L-D-sEV, and cell viability was measured by CCK-8 assay. (C) The Arg-1 and CD206 gene levels of RAW264.7 cells were measured by qRT–PCR. (D) The percentage of M2 macrophages was measured by flow cytometry. Double-positive cells (CD206 and F4/80) represented M2 macrophages. Data are shown as the mean ± SEM for three independent experiments. *P < 0.05; **P < 0.01; ***P < 0.001.
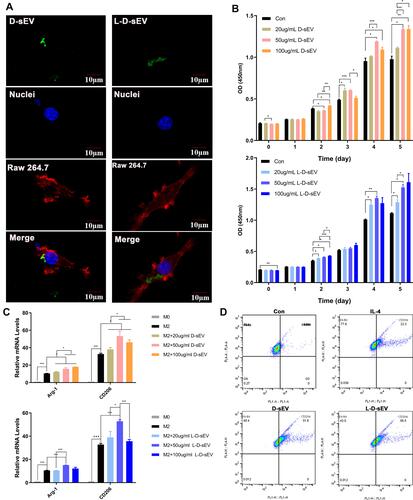
Figure 5 L-D-sEV promoted M2 polarization via ROS/ERK signaling. (A) The percentage of M2 macrophages was measured by flow cytometry. RAW264.7 cells were treated with D-sEV or L-D-sEV (50 μg/mL, 6 h) with or without 25 μM H2O2 or 10 mM NAC stimulation. (B) The GSSG/GSH ratio of macrophage. RAW264.7 cells were treated with D-sEV or L-D-sEV (50 µg/mL, 6 h). (C) The SOD1, SOD2, ERK and p-ERK protein levels were measured by Western blot. Raw264.7 Cells were first pretreated with or without u1206 (10 µM, 30 min) and then cocultured with or without D-sEV or L-D-sEV (50 µg/mL, 6 h). (D) Quantitative analysis of the protein bands in Figure 5C. (E) Intracellular ROS levels were measured by flow cytometry and quantitative analysis. RAW264.7 cells were first pretreated with or without u1206 (10 µM, 30 min) and then cocultured with or without D-sEV or L-D-sEV (50 µg/mL, 6 h). (F) Illustration showing that sEV promotes M2 polarization via SOD1/ERK-mediated ROS. Data are shown as the mean ± SEM for three independent experiments. *P < 0.05; **P < 0.01; ***P < 0.001.
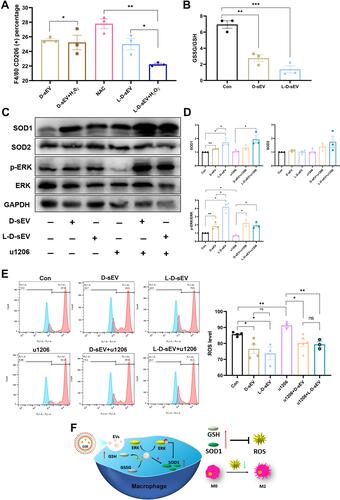
Figure 6 Physical and biological characterization of HA/sEV. (A) The schematic diagram of material construction. (B) The dynamic viscosity of the mixture of sEV (dissolved in PBS) and HA with different volume ratios (0.125, 0.25, 0.5). (C) The frequency scanning analysis. (D) Release experiment of the D-sEV-loaded HA. (E) Release experiment of the L-D-sEV-loaded HA. (F) The effect of (5%, 10%, 20%) HA or 5% HA with D-sEV or L-D-sEV (200 μg/mL) on PDLSCs viability was measured by CCK-8 assay. (G) Representative images of the cell migration assay and quantitative analysis. Scale bar: 200 μm. Data are shown as the mean ± SEM for three independent experiments. *P < 0.05; **P < 0.01; ***P < 0.001.
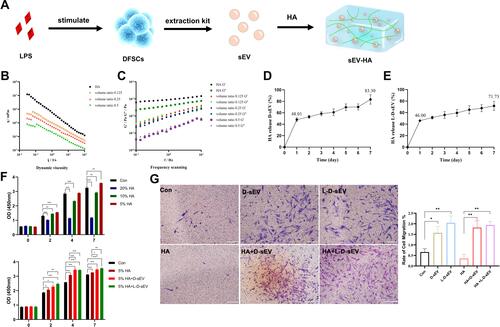
Figure 7 HA/sEV promoted periodontal regeneration in vivo. (A) Representative micro-CT images showing new bone formation in the PD, PBS, D-sEV, and L-D-sEV groups at 8 weeks post-injection. Scale bar: 1 mm. The red box represents the bone defect size. (B) The BV/TV and Tb. SP comparison. (C) The representative H&E stained sections. Scale bar: 200 μm. (D) The representative Masson stained sections. The black arrow represents Notch. (E) Quantitative analysis of PDL width. (F) The number of vessels in the PDL. (G) Representative images of Periostin immunofluorescence staining in PDL. Scale bar:100 μm. (H) Quantitative analysis of Periostin expression in PDL. (I) Representative images of CD206 immunofluorescence staining in ALB. Scale bar: 100 μm. (J) Quantitative analysis of CD206 expression in ALB. (K) Representative images of RANKL immunofluorescence staining in PDL. Scale bar: 100 μm. (L) Representative images of OPG immunofluorescence staining in PDL. Scale bar: 100 μm. (M) Quantitative analysis of RANKL/OPG ratio in PDL. Data are shown as the mean ± SEM for three independent experiments. *P < 0.05; **P < 0.01; ***P < 0.001.
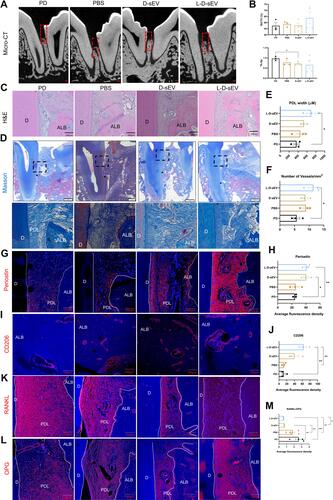
Table 4 Serum IgA, IgG, IgM, C3, C4, and CRP Levels in Canine