Figures & data
Figure 1 (A) cut the skin and created 3mm diameter of tibial bone defects. (B) placed the BPN-DFO hydrogel in the defect. (C) hydrogels photo-crosslinking using 365 nm ultraviolet lamp irradiation.
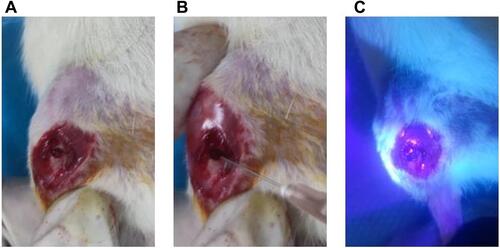
Table 1 The Macroscopic and Histological Evaluation of Regeneration Bone Tissue
Figure 2 (A) Swelling rate of the BPN-DFO hydrogel and hydrogel in ultrapure water at room temperature. (B) Degradation rate of the BPN-DFO hydrogel and hydrogel.
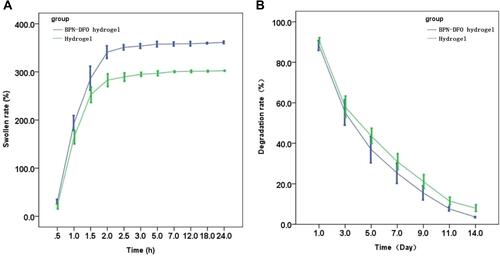
Figure 3 Vitro phosphorus and ferric ion release cumulative percentage of BPN-DFO hydrogel. (A) The release cumulative percentage of phosphorus ion showed a sustained release during 21 days. (B) The release cumulative percentage of ferric ion are burst during the initial 24 h, then a constantly slow release after 48 h.
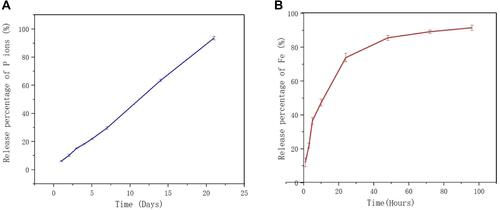
Figure 4 The live/dead stain fluorescence image of hBMSCs incubated at 1 and 3 days in two groups, respectively, and there were no dead cells (red) in two group. (A, B) The live/dead stain fluorescence image of BPN-DFO group. (C, D) The live/dead stain fluorescence image of hydrogel group.
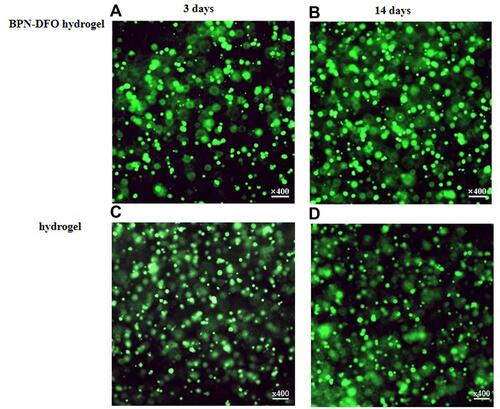
Figure 5 Summarized data showing the effect of BPN-DFO hydrogel and hydrogel on mRNA expression of osteogenic differentiation related genes including Col-I, BMP4 and Runx2 after culturing for 7 and 14 days in vitro. (A) The expression of Col I in BPN-DFO group showed significantly improved than control group and hydrogel group at 7 and 14 days. (B) The expression of BMP4 in BPN-DFO group showed significantly improved than control group and hydrogel group at 7 and 14 days. (C) The expression of Runx 2 in BPN-DFO group showed significantly improved than control group and hydrogel group at 7 and 14 days. (*, p<0.05).
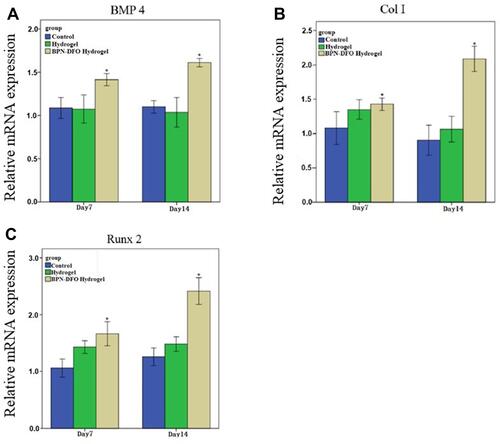
Table 2 Comparison of Macroscopic and Histology Scale Between Two Group
Figure 6 The macroscopic presence of bone defect site in tibial. 2 and 4 weeks in BPN-DFO hydrogel group and hydrogel group.
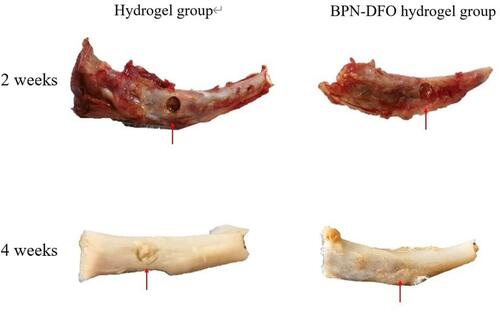
Figure 7 Bone defect repair in the tibial model. H&E staining and Masson staining of histological sections were performed 2 and 4 weeks after implantation. The left part is H&E staining and right part is Masson staining.
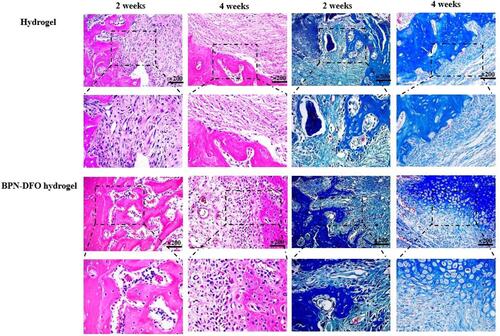
Figure 8 Bone defect repair in the tibial model. Immunohistochemistry analysis (COL I, CD31) of sections were performed 2 and 4 weeks after implantation. The left part is IHC of COL I and right part is IHC of CD 31. And in these two parts, tawny color meaning the positive, which present COL I and CD 31, respectively.
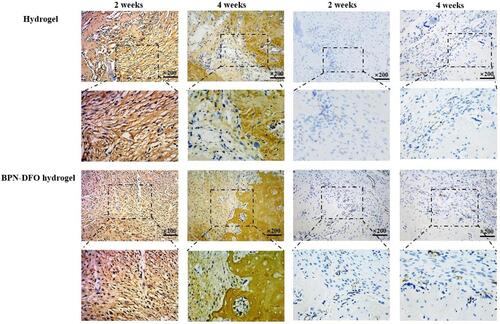
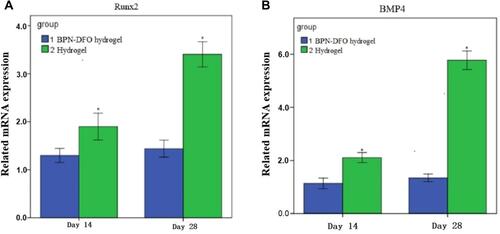
Figure 9 Summarized data showing the effect of BPN-DFO hydrogel and hydrogel on mRNA expression of BMP4 and Runx2 after culturing for 14 and 28 days in vivo. (A) The expression of Runx 2 in BPN-DFO group showed significantly improved than Hydrogel group at 14 and 28 days. (B) The expression of BPM 4 in BPN-DFO group showed significantly improved than Hydrogel group at 14 and 28 days. (*, p<0.05).