Figures & data
Figure 1 The cells showed green fluorescence (A) and blue after staining by potassium ferrocyanide (B). The distribution of iron was consistent with the distribution of fluorescence, which indicated that the cell membrane of CMECs could be penetrated by FITC-Tat-PTD-USPIO-Aβ(16–20).
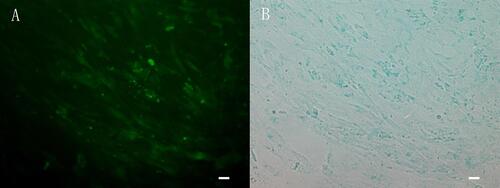
Figure 2 The MRI images of CMECs and FITC-Tat-PTD-USPIO-Aβ(16–20) incubated for 48h in vitro. The tube 1 was unused culture medium. The deposits in the bottom of tube 2 and 3 were CMECs incubated without and with Tat-PTD-USPIO-Aβ(16–20), in which culture medium was added to match the volume. Tube 4 was the pure contrast agent. The results indicated that the MRI contrast agents could decrease the relaxation time of CMECs. There was a T1-weighted image (A), T2-weighted images (B–F), and cross-sectional images (C–F). The images were coronal scanning (A and B) and plain scanning (B–F) of the four upright tubes.
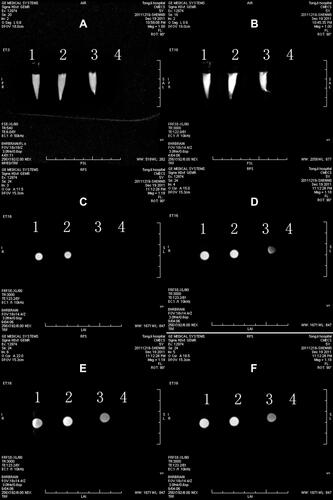
Figure 3 Histogram of toxicity test. Cell viability of untreated control cells is 100%. Aβ(1–40) or Aβ(16–20) alone was toxic as expected (n=3; p<0.001, p<0.001, respectively). There was no evidence that Tat-PTD and Aβ(16–20) coupled with USPIO have significant toxicity compared to the control group. Student-Newman-Keuls analysis showed the differences of Aβ(1–40) vs control, Aβ(1–40) vs USPIO, Aβ(1–40) vs Tat-PTD-USPIO, Aβ(1–40) vs Tat-PTD-USPIO-Aβ(16–20), Aβ(16–20) vs control, Aβ(16–20) vs Tat-PTD-USPIO, Aβ(16–20) vs Tat-PTD-USPIO-Aβ(16–20), Tat-PTD-USPIO-Aβ(1–40) vs control and USPIO vs control were all significant (n=3; all p<0.05). Tat-PTD-USPIO-Aβ(16–20) vs control and Tat-PTD-USPIO vs control had no statistical difference. *p<0.05.
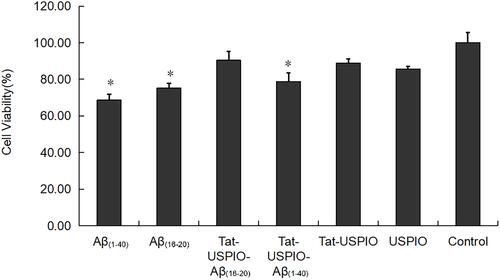
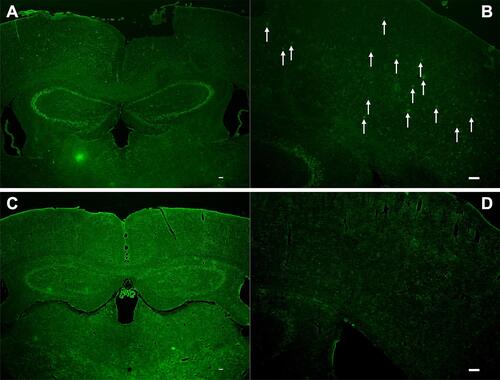
Figure 4 The transgenic mice injected Tat-PTD-USPIO-Aβ(16–20)-HiLyte Fluor 555 were imaged with in vivo MRI to detect Amyloid plaques. It was the T2-weighted image (A) and partial enlarged (B). The red fluorescence referred deposits of the contrast agents in the frozen brain section (C), and the green fluorescence meant the senile plaques stained by Thioflavin-S (D). The match of the red and green fluorescence in one section manifested that the contrast agents could bind to senile plaques in vivo. The distribution of dark spots in the T2-weighted image matched to the distributions of red and green fluorescence, which indicated this MRI contrast agents could bind to the senile plaques of APP/PS1 transgenic mice and also decreased the signal of them. The arrows indicated the contrast agents bounding to the senile plaques in vivo.
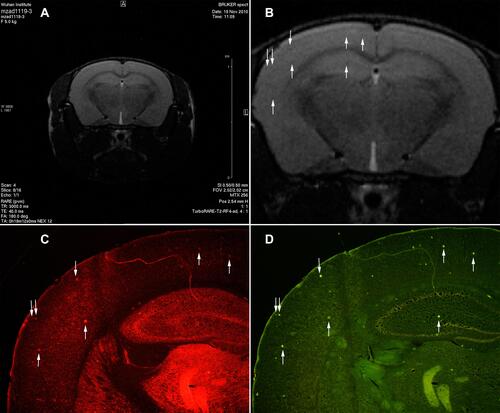
Figure 5 The frozen brain sections were incubated with FITC-Tat-PTD-USPIO-Aβ(16–20). The frozen brain sections of AD transgenic mice showed green fluorescent spots, and were similar with the distribution of senile plaques (A and B). No similar spots were on the frozen brain sections of wild-type mice (C and D). The arrows indicated the contrast agents bounding to the senile plaques in vivo.