Figures & data
Figure 1 Synthesis of the amphiphilic dendron: (i) n-C12H25NH2, CHCl3, NaOH (aq.); (ii) piperazine, CHCl3; (iii) BrGnVm, K2CO3, 18-crown-6, KI, acetone; (iv) HS(CH2)2N(CH3)2·HCl, DMPA, 365 nm UV, THF:CH3OH.
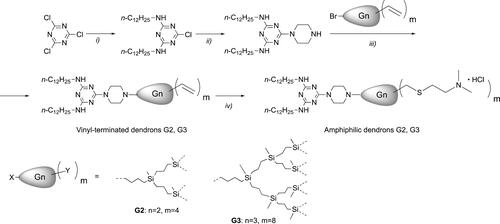
Figure 2 Structures of amphiphilic triazine–carbosilane dendrons of 2nd and 3rd generation.
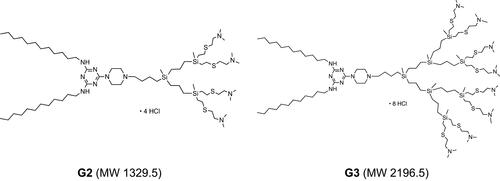
Figure 3 DLS profiles for supramolecular associates of the amphiphilic dendron G3 (100 μM) exposed to different pH in 10 mM Na-phosphate buffer.
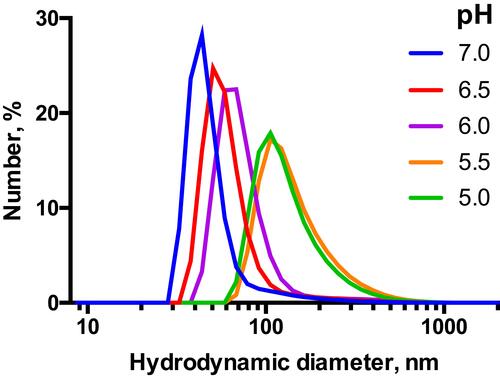
Table 1 Size and Zeta Potential of Rose Bengal-Loaded Dendrimersomes (G2-RB and G3-RB) as Well as Free Dendrimersomes (G2 and G3).
Figure 4 Changes in fluorescence and absorbance spectra of RB after encapsulation within dendrimersomes. The measurements of absorbance and fluorescence intensity were carried out for the tested compounds at RB concentrations of 5 and 1 μM, respectively.
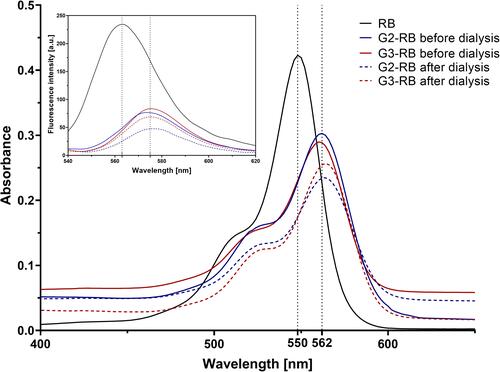
Figure 5 Release of RB from G2-RB and G3-RB dendrimersomes at pH 5.5. Percentage of release was determined relative to the first sample (0 h, 100% of initial absorbance). *Statistically significant difference at p < 0.05 between the two generations of dendrimersomes. Data are presented as means ± SD, n=3.
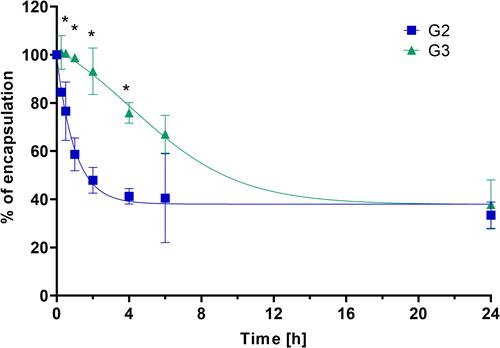
Figure 6 Singlet oxygen generation by free RB and dendrimersomes loaded with RB (G2-RB and G3-RB), determined using an ABDA probe. *Statistically significant difference at p<0.05 between G3-RB or G2-RB and RB. ^ Statistically significant difference at p<0.05 between G2-RB and G3-RB. Data are presented as means ± SD, n=3.
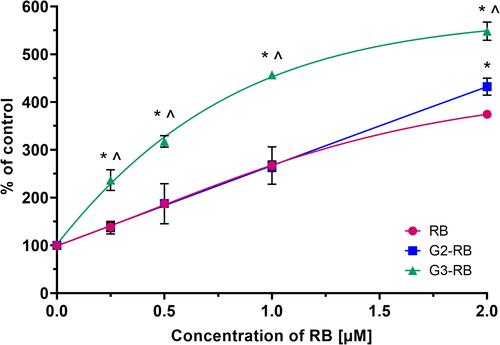
Figure 7 (A) Uptake of free RB and dendrimersomes loaded with RB (G2-RB and G3-RB) by AsZ cells. Data are presented as means ± SD, n=3. *Statistically significant difference at p<0.05 between evaluated compounds and RB. (B) Confocal micrographs: (1) Phalloidin–Atto 633; (2) Hoechst 33342; (3) rose bengal; (4) bright field image; (5) merge of channels 1, 2, and 3. Scale bar represents 20 µm.
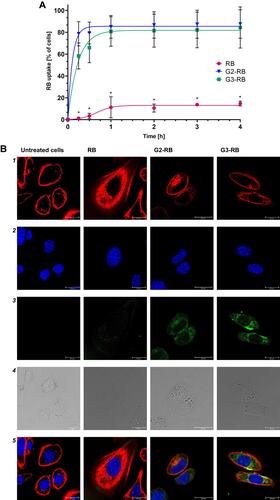
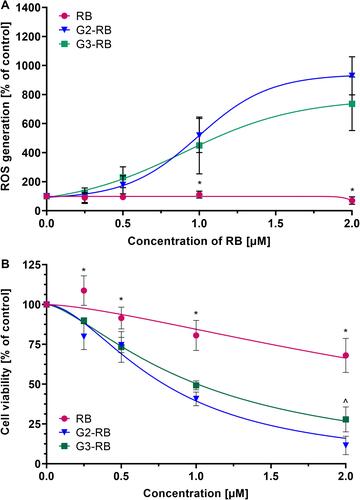
Figure 8 (A) ROS generation and (B) phototoxic activity of free RB and RB-loaded dendrimersomes (G2-RB and G3-RB) on AsZ cells. Data are presented as means ± SD, n=3. *Statistically significant difference at p<0.05 between RB and G2-RB or G3-RB. ^ Statistically significant difference at p<0.05 between G2-RB and G3-RB.