Figures & data
Figure 1 Preparation process of HTPM. HTPM were prepared using the thin-film hydration method as reported previously. Briefly, HF and TPGS were first dissolved in methanol to obtain the transparent organic phase. Then, the organic phase was gradually evaporated to form a thin film on the surface of the distillation flask. The deionized water was further added into the distillation flask; then, an ultrasonic cell disruption device (300 mV, 20 min) was used to acquire HTPM.
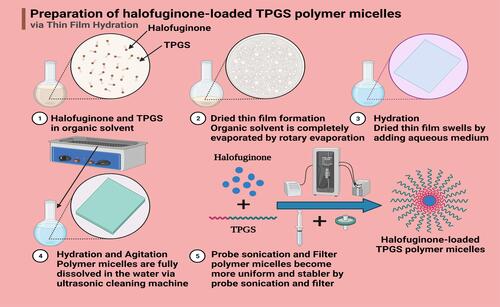
Figure 2 Characterization of HTPM. Hydrodynamic diameters (A) and zeta potentials (B) of HTPM were determined by dynamic light scattering. The surface morphology (C) of HTPM was observed by transmission electron microscopy (TEM).
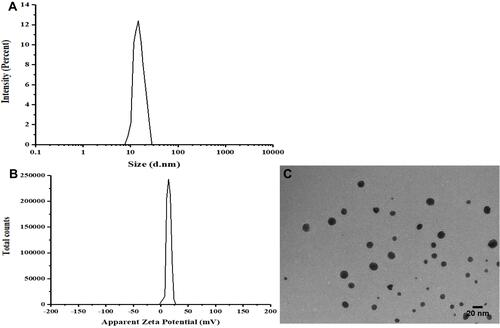
Figure 3 Stability of HTPM and in vitro drug release profiles of HF and HTPM in the simulated gastrointestinal fluids. The stability of HTPM in the simulated gastric (pH 1.23) and intestinal (pH 6.8) fluids were evaluated by the change of hydrodynamic diameter (A) and zeta potential (B) during 1-day storage. In vitro drug release profiles of HTPM and HF in the simulated gastric (C) and intestinal (D) fluids were investigated using the dialysis bag method.
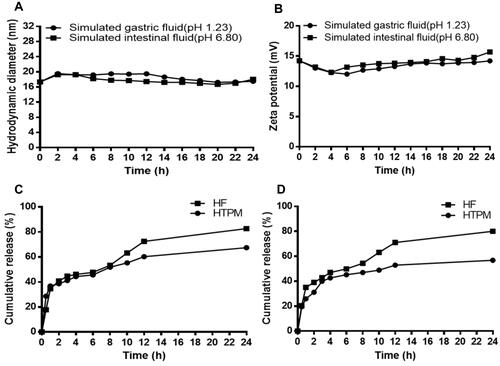
Table 1 Permeability and Efflux Rate (ER) of HF and HTPM Transport into Caco-2 Cell Monolayers
Figure 4 Permeability and transport patterns of HTPM across Caco-2 cell monolayers. The Papp values of HF and HTPM treated with (+) /without (-) verapamil were detected in the AP→BL side (A) and BL→AP side (B), respectively. Effect of temperature on the Papp of HTPM across Caco-2 cells monolayer was studied at 4°C and 37°C (C). Effect of various endocytosis inhibitors on the Papp values of HTPM (D) was analyzed. *P < 0.05, **P < 0.01.
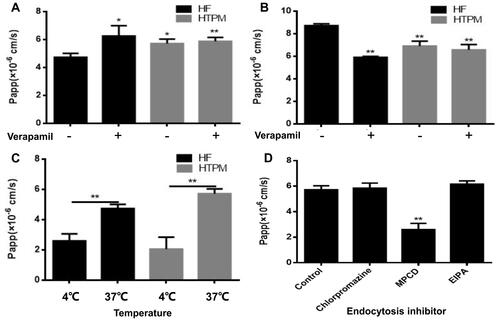
Figure 5 Anticancer effect of HTPM orally administrated against subcutaneous TNBC xenografts in nude mice. Pattern diagram (A), tumor volumes (B), morphology of the harvested tumors (C), tumors weights (D), body weights (E and F) of nude mice after oral administration of PBS, HF, or HTPM were exhibited. **P < 0.01, ***P < 0.001.
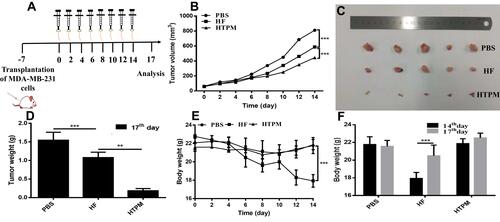
Figure 6 Histological analysis of main organs and tissues from subcutaneous tumor-bearing mice treated with HTPM orally administrated. All the samples were analyzed using H&E staining. The place pointed by the black solid arrow in the jejunum picture of HF group represents the phenomenon of jejunum hemorrhage. Further, places pointed by the black dotted arrow in the tumor picture of HF group and HTPM group demonstrate generation of apoptosis for tumor tissues. Images were taken at 200× magnification.
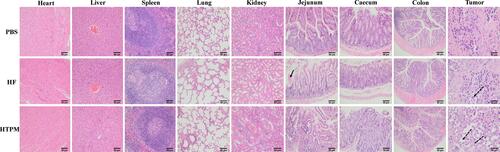
Figure 7 Apoptosis of tumor tissues from subcutaneous tumor-bearing mice treated with HTPM orally administrated. TUNEL staining was utilized to detect the apoptosis of tumor tissues, and the expression of apoptosis-related proteins including Bcl-2, Bax and Caspase-3 were investigated using immunohistochemistry. Places pointed by the brown solid arrow in the TUNEL Staining, bax and caspase-3 for HF and HTPM represent generation of apoptosis for tumor tissues, which appear brown color. Furthermore, Places pointed by the black solid arrow in the bcl-2 for HF and HTPM indicate anti-apoptosis for tumor tissues. Images were taken at 400× magnification. *P < 0.05, **P < 0.01, ***P < 0.001.
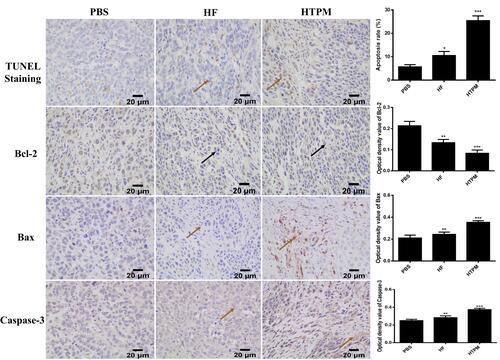
Figure 8 Therapeutic effect of HTPM administrated orally combined and surgery on orthotopic TNBC in nude mice. Tumor volumes (A), morphology of the harvested tumors (B), tumors weights (C), body weights (D ând E) and morphology of lung metastasis (F) of orthotopic tumor-bearing mice with surgical resection after oral administration of PBS, FTPM, HF and HTPM were exhibited. Places pointed by the black solid arrow in the (F) were displayed appearance of white metastases in the lungs. *P < 0.05, **P < 0.01, ***P < 0.001.
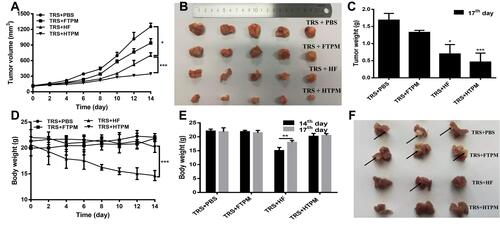
Figure 9 Histological analysis of lungs (200×), jejunums (100×) and tumors (200×) from orthotopic tumor-bearing mice treated with TRS+PBS, TRS+FTPM, TRS+HF and TRS+HTPM using H&E staining. Places pointed by the black point arrow and black box area in the lung slices picture for the TRS+PBS group and TRS+FTPM group were showed lungs appear or were filled with breast cancer parenchyma cells. Further, the place pointed by the black solid arrow in the jejunum picture of TRS+HF group represents the phenomenon of jejunum hemorrhage. Alternatively, places pointed by the black dotted arrow in the tumor picture of TRS+HF group and TRS+HTPM group demonstrate generation of apoptosis for tumor tissues. Images were taken at 200× and 100× magnification.
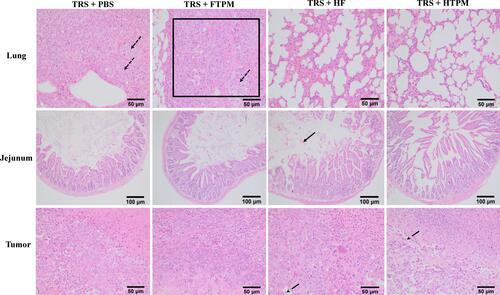
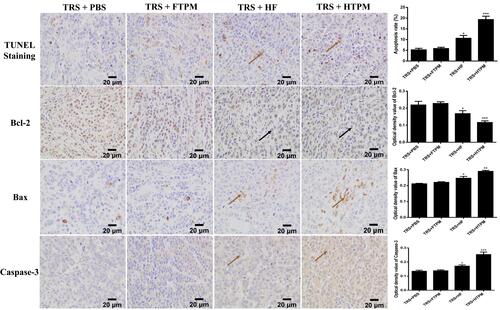
Figure 10 Apoptosis of tumor tissues from orthotopic tumor-bearing treated mice with TRS+PBS, TRS+FTPM, TRS+HF and TRS+HTPM. Places pointed by the brown solid arrow in the TUNEL Staining, bax and caspase-3 for TRS+HF and TRS+HTPM represent generation of apoptosis for tumor tissues, which appear brown color. Furthermore, Places pointed by the black solid arrow in the bcl-2 for TRS+HF and TRS+HTPM indicate anti-apoptosis for tumor tissues. Images were taken at 400× magnification. *P < 0.05, **P < 0.01, ***P < 0.001.