Figures & data
Figure 1 Characterization of MSE-NC. (A and B) Transmission electron photomicrographs of MSE-NC; (C) Scanning electron photomicrograph of MSE-NC; (D) Histogram of the distribution of MSE-NC diameters.
Abbreviation: MSE-NC, poly(lactic-co-glycolic acid)-nanocapsules loaded with magnetic nanoparticles and selol.
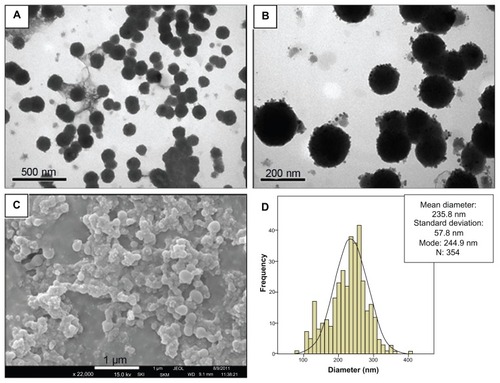
Figure 2 Characterization of maghemite nanoparticles. (A) Transmission electron photomicrograph of maghemite nanoparticles prior to the encapsulation process; (B) Histogram of the distribution of maghemite nanoparticle diameters.
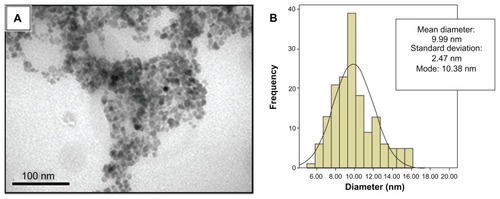
Figure 3 Transmission electron photomicrograph of M-NC showing dispersed nanoparticles on its surface.
Abbreviation: M-NC, poly(lactic-co-glycolic acid)-nanocapsules loaded with magnetic nanoparticles.
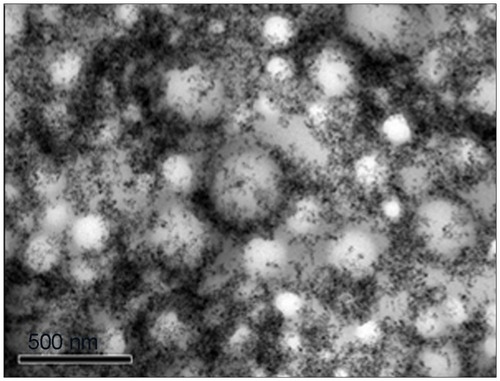
Table 1 Characterization of PLGA-nanocapsules from MSE-NC, M-NC, and SE-NC samples by PCS and Zetasizer
Figure 4 Effects of MSE-NC and control nanoformulation (M-NC and SE-NC) treatments of 24 hours and 48 hours on the viability of 4T1 (A), MCF-7 (B), and MCF-10A (C) cells.
Notes: Data were normalized with control (untreated) cell viability (100%) and expressed as the percentage of the mean ± SEM of three independent experiments performed in triplicate. *Denotes statistical difference with respect to the control without treatment; adenotes the statistical difference with respect to the MSE-NC at the same concentration. P < 0.05. The values expressed are 1X − 25 μg/mL of selol and/or 1.25 × 10⁹ particles/mL; 2X − 50 μg/mL of selol and/or 2.5 × 10⁹ particles/mL; 4X − 100 μg/mL of selol and/or 5 × 10⁹ particles/mL; 8X − 200 μg/mL of selol and/or 1 × 10¹⁰ particles/mL; 16X − 400 μg/mL of selol and/or 2 × 10¹⁰ particles/mL; PT − 40 μg/mL of Paclitaxel.
Abbreviations: MSE-NC, selol-loaded magnetic nanocapsules; M-NC, unloaded magnetic nanocapsules; SE-NC, nonmagnetic nanocapsules of selol.
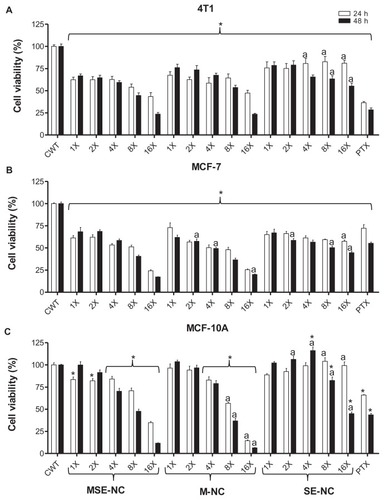
Table 2 Distribution of the IC50 values and their respective confidence intervals (95%) in 4T1, MCF-7, and MCF-10A cell lines after treatment with MSE-NC
Figure 5 Cell morphology of MCF-7 cells after 48 hours without treatment. Giemsa staining. Arrows indicate clusters of magnetic nanostructures, which can be visualized by brown staining. Figures A and B show absence of cluster of magnetic nanostructures. Bars indicate 100 μm. (A) Treatment with MSE-NC containing 200 μg/mL of selol + 1 × 10¹⁰ particles/mL (8X); (C) 100 μg/mL of selol + 5 × 10⁹ particles/mL (4X); (D) 50 μg/mL of selol + 2.5 × 10⁹ particles/mL (2X); (E) treatment with M-NC (5 × 10⁹ particles/mL − 4X); (F) treatment with SE-NC (100 μg/mL of selol − 4X).
Abbreviations: MSE-NC, selol-loaded magnetic nanocapsules; M-NC, unloaded magnetic nanocapsules; SE-NC, nonmagnetic nanocapsules of selol.
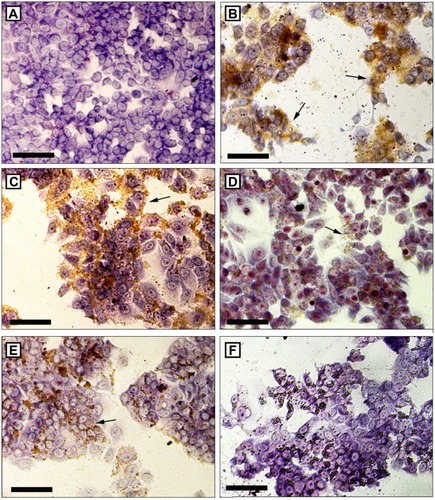
Figure 6 Perls staining of 4T1 (A and B), MCF-7 (C and D) and MCF-10A (E and F) after 48 hours without treatment (A, C and E) or after the treatment with 100 μL/mL of selol + 5 × 10⁹ particles/mL (4X) (B, D and F).
Notes: Clusters of magnetic nanoparticles are stained in blue. Higher amounts of pigment blue are visualized in neoplastic tumor cells. Bars indicate 100 μm.
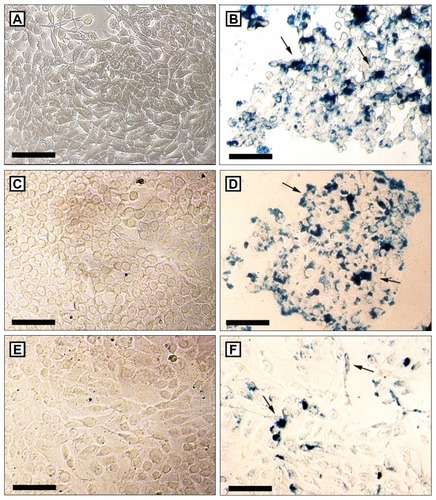
Figure 7 Effects of 48 hours of treatment with nanocapsules MSE-NC, M-NC, and SE-NC on the percentage of cells positively stained for annexin-V.
Notes: Breast carcinoma cells (4T1 and MCF-7 lines) were stained with Annexin V-FITC and propidium iodide and analyzed by flow cytometry. Data were normalized with the untreated control and expressed as percentage of the mean ± SEM of two independent experiments performed in triplicate. *Denotes the statistical difference with respect to the control group without treatment (CWT); adenotes the statistical difference with respect to MSE-NC-2X; P < 0.05. 2X = 50 μg/mL of selol and/or 2.5 × 10⁹ particles/mL; 8X = 200 μg/mL of selol +1 × 10¹⁰ particles/mL.
Abbreviations: MSE-NC, PLGA-nanocapsules loaded with magnetic nanoparticles and selol; M-NC, PLGA-nanocapsules loaded with magnetic nanoparticles; SE-NC, PLGA-nanocapsules loaded with selol; CWT, control with no treatment; PTX, Paclitaxel.
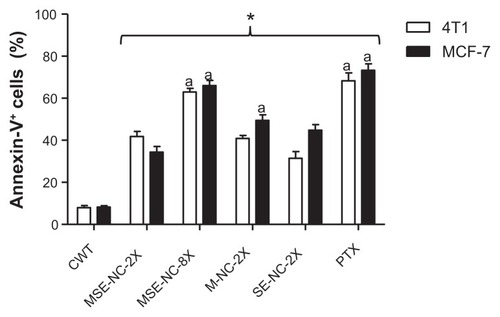
Figure 8 Effects of 48 hours treatment with nanocapsules MSE-NC, M-NC, and SE-NC on the percentage of DNA fragmentation in 4T1 and MCF-7 cell lines.
Note: Breast carcinoma cells were stained with propidium iodide and analyzed by flow cytometry. Data were normalized with the untreated control and expressed as percentage of the mean ± SEM of two independent experiments performed in triplicate. *Denotes the statistical difference with respect to the control group without treatment (CWT); adenotes the statistical difference with respect to MSE-NC-2X; P < 0.05. 2X = 50 μg/mL of selol and/or 2.5 × 10⁹ particles/mL; 8X = 200 μg/mL of selol + 1 × 10¹⁰ particles/mL.
Abbreviations: MSE-NC, PLGA-nanocapsules loaded with magnetic nanoparticles and selol; M-NC, PLGA-nanocapsules loaded with magnetic nanoparticles; SE-NC, PLGA-nanocapsules loaded with selol; CWT, control with no treatment; PTX, Paclitaxel.
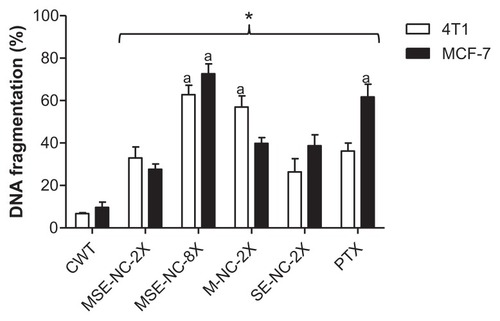
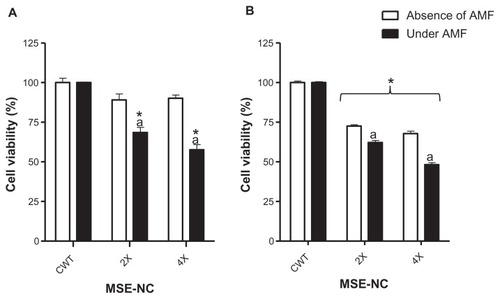
Figure 9 Effects of MSE-NC treatment with or without subsequent exposure to the AMF on the viability of the 4T1 (A) and MCF-7 (B) cell lines.
Notes: Data were normalized with the untreated control exposed or not to AMF and expressed as percentage of the mean ± SEM of three independent experiments performed in triplicate. *Denotes the statistical difference for the CWT; adenotes the statistical difference with respect to the same MSE-NC concentration, but without AMF application; P < 0.05. The values are as follows: 2X = 50 μg/mL of selol + 2.5 × 10⁹ particles/mL; 4X = 100 μg/mL of selol + 5 × 10⁹ particles/mL.
Abbreviations: MSE-NC, nanocapsules loaded with magnetic nanoparticles and selol; CWT, control without treatment; AMF, alternating magnetic field.