Figures & data
Figure 1 A schematic diagram of the experimental procedure.
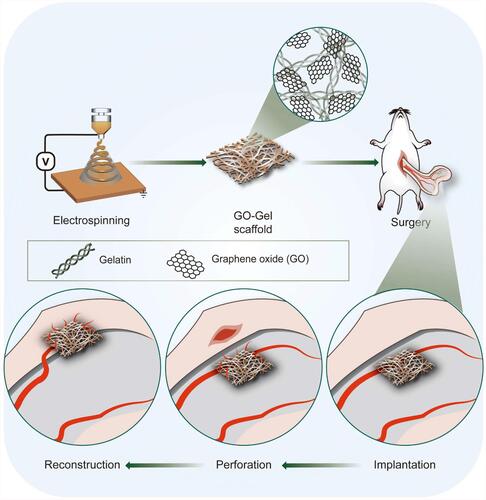
Figure 2 Characterization of the GO-Gel scaffolds. (A) Macrographs, FESEM images, and diameter distribution of the nanofibers (Scale bar: low magnification= 10μm, high magnification=5μm). (B) FTIR spectroscopy, (C) Raman spectroscopy, (D) XRD pattern, (E) tensile stress-strain curve, (F) tensile strength, and (G) Young’s modulus of the scaffolds (mean±SD, *P-value <0.05).
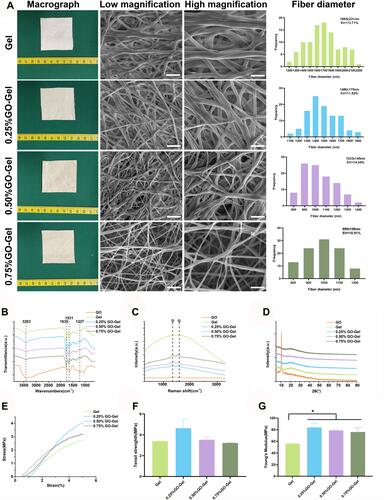
Figure 3 In vitro cytocompatibility of the scaffolds. Confocal fluorescent images showing CAM/PI staining of (A) HUVEC and (C) IEC-6 cells on the scaffolds after culturing for one, four, and seven days. FESEM images showing (B) HUVEC and (D) IEC-6 cells seeded on the scaffolds (scale bar=10μm). Results of the MTT assay performed on (E) HUVEC and (F) IEC-6 cells seeded on the scaffolds (*P-value <0.05, **P-value <0.01).
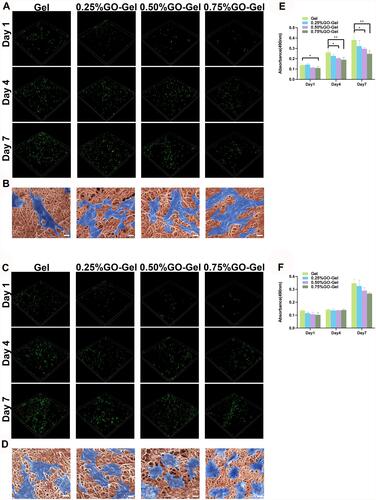
Figure 4 Evaluation of the implantation surgery and pre-vascularization process. (A) Time course of the in vivo experiments and photos of the implantation surgery. The black arrow shows the residual scaffold materials, while the green arrow shows the pre-embedded vessels. (B) Panoramic view of the HE staining of the vascularized scaffolds harvested at week 4. (C) High magnification images of the residual scaffold are marked with blue dotted lines. (D) High magnification images of the central area are marked with red dotted lines. (E) Immunofluorescence images of CD31, α-SMA, DAPI, and merger of the central area. (F) Immunofluorescence images of CD31, α-SMA, DAPI, and merger of the scaffold area. Yellow arrow shows the neovessels. (A scale bar=5mm; B scale bar=200μm; C-F scale bar=50μm). (G) Histogram showing the number of blood vessels/area (mean±SD, **P-value <0.01).
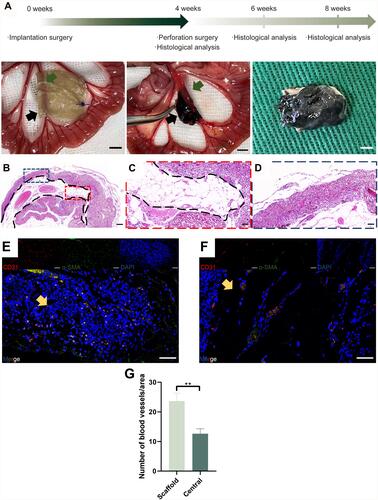
Figure 5 Evaluation of the perforation surgery and repair process. (A) Time course of the in vivo experiments and photos of the perforation surgery. The black arrow shows the perforation and repair area. (B–D) Macroscopic photographs showing the intestinal wounds acquired on week 2 after treatment with different scaffolds. (E–G) Macroscopic photographs showing the intestinal wounds acquired on week 4 after treatment with different scaffolds. (A scale bar=5mm; B-G scale bar=2mm).
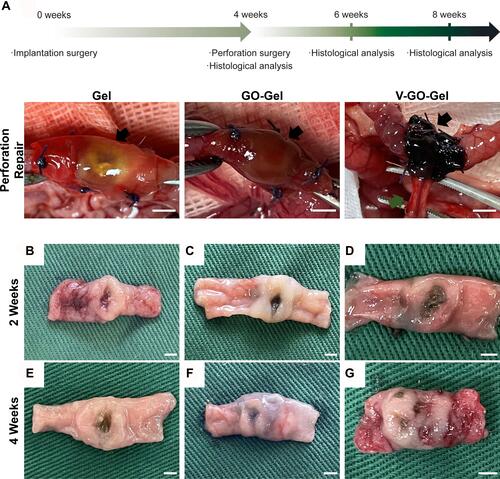
Figure 6 Histological analysis of the vascularized scaffolds 4 weeks after perforation surgery. Panoramic view of the H&E staining (A–C) and Masson’s trichrome staining (J–L) of the intestinal wounds acquired on week 4 after treatment with different scaffolds. (scale bar=500μm). High magnification images of the HE staining (D–I) and Masson’s trichrome staining (M–R) of intestinal wounds acquired on week 4 after treatment with different scaffolds (scale bar=100μm). The yellow arrow indicates the residual graphene oxide sheet.
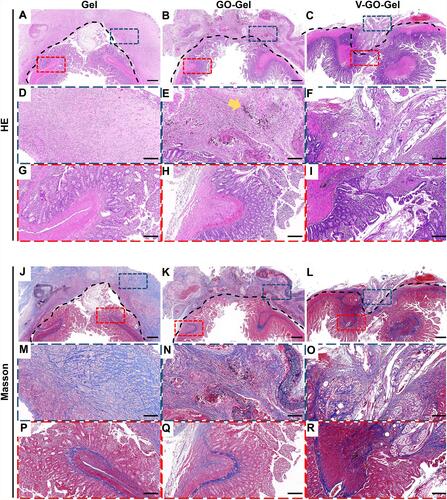
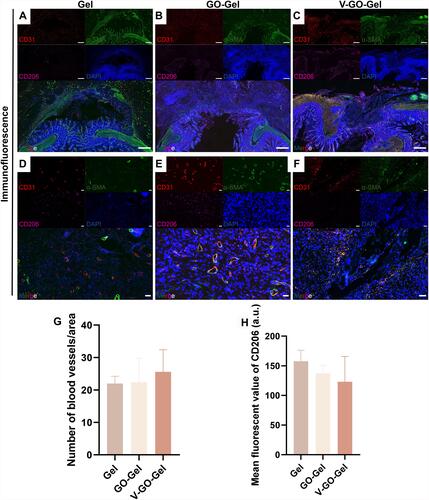
Figure 7 Neovascularization of the intestinal wounds four weeks after perforation surgery. (A–C) Immunofluorescence images of CD31, α-SMA, CD206, DAPI, and merger of intestinal wounds acquired on week 4 after treatment with different scaffolds (scale bar=500μm). (D–F) High magnification images of Immunofluorescence images acquired on week 4 after treatment with different scaffolds (scale bar=20μm). (G) Histogram showing the number of blood vessels/area. (mean±SD). (H) Quantitative analysis of the CD206 cells (mean±SD).