Figures & data
Figure 1 (A) Dissection of Achilles tendon. (B) Repair of the tendon with suture. (C) Wrapping of simvastatin-loaded membrane onto repaired tendon.
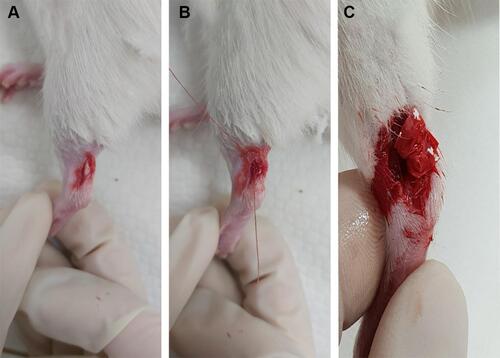
Figure 2 SEM image and fiber size distribution of nanofibers with a PLGA:simvastatin ratio of (A) 1:1 and (B) 2:1.
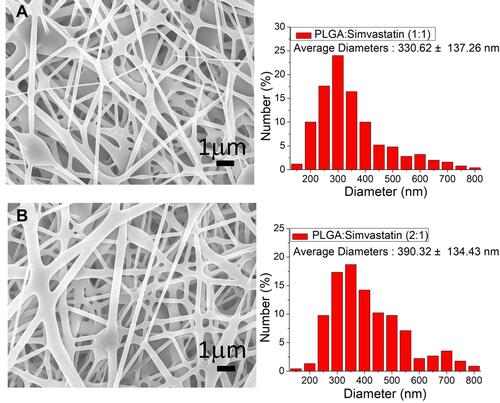
Figure 3 Wetting angles of (A) pure PLGA membrane, (B) PLGA:simvastatin 1:1 membrane, and (C) PLGA:simvastatin 2:1 membrane.
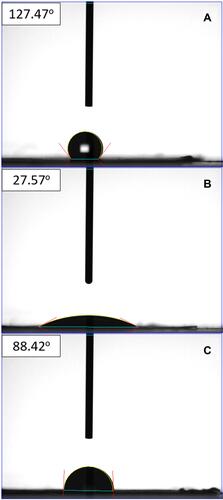
Figure 4 FTIR spectra of PLGA and simvastatin-loaded PLGA nanofibers.
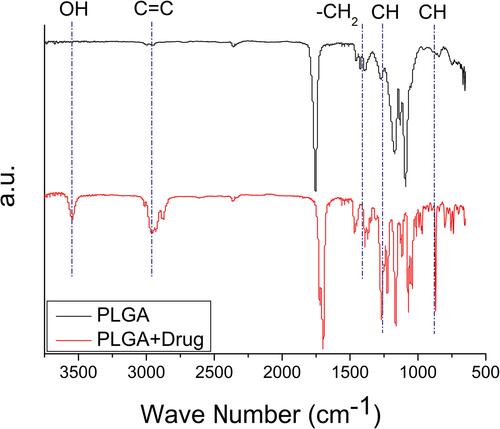
Figure 5 Thermal behaviors of PLGA, simvastatin, and simvastatin-loaded PLGA nanofibers.
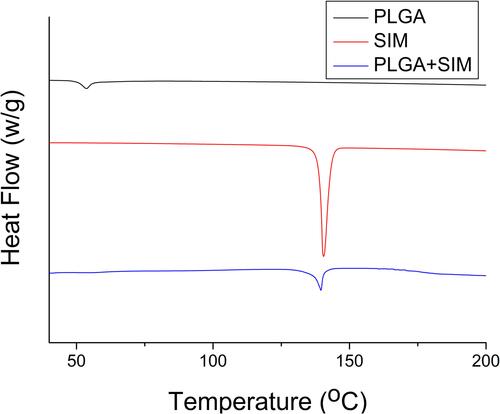
Figure 6 In vitro (A) daily and (B) cumulative release of simvastatin from PLGA nanofibers.
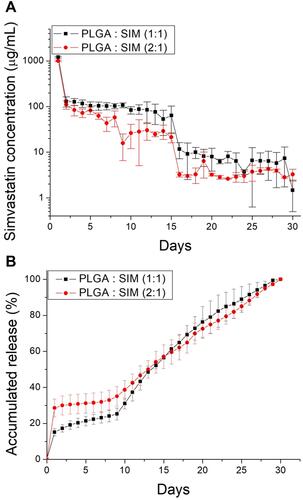
Figure 7 In vivo release of simvastatin-incorporated nanofibers.
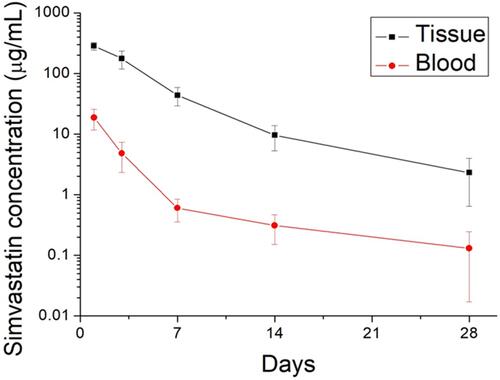
Figure 8 Mechanical strength of retrieved tendons at (A) 1, (B) 2, and (C) 4 weeks post operation.
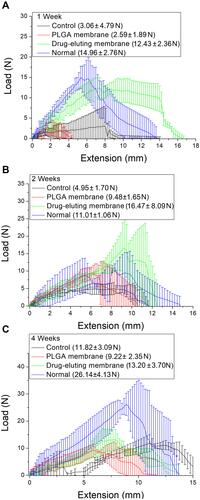
Figure 9 Animal activity counts of rats in various groups. (*p<0.05; **p<0.01).
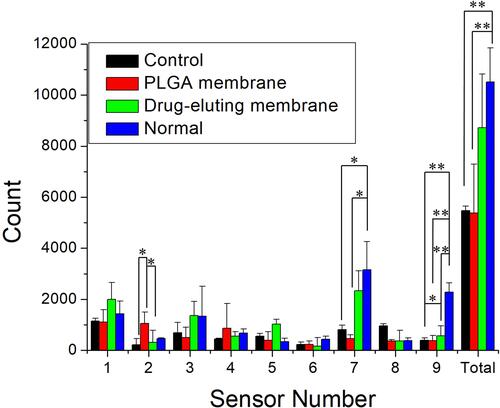
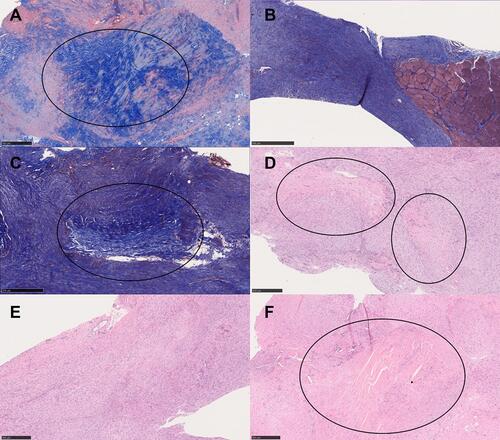
Figure 10 Histology results at 2 weeks with trichrome staining (A–C) and H&E staining (D–F). (A) Trichrome staining of the control group. (B) Trichrome staining of the PLGA membrane group. (C) Trichrome staining of the drug-eluting membrane group. (D) H&E staining of the control group. (E) H&E staining of the PLGA membrane group. (F) H&E staining of the drug-eluting membrane group. The black circle shows the area with dense collagen fiber, which was largest in the drug-eluting membrane group. Scale bar: 500 μm.